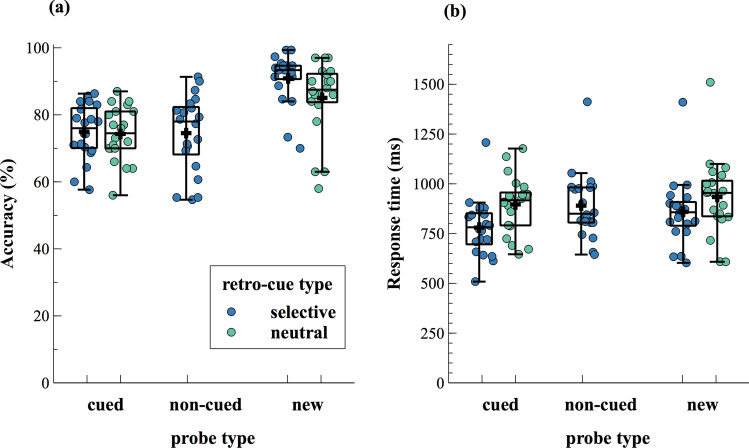
Figure 2.
Accuracy (a) and response times (b), depending on retro-cue type and probe type. Boxplots illustrate the interquartile range and the median. Whiskers extend to 1.5 times the interquartile range. The dots indicate individual participants’ mean scores per condition. A black cross denotes the mean values across subjects for each condition. Note that in neutral retro-cue trials both items remained relevant and thus, a “cued probe” could be either one of those two sounds.

