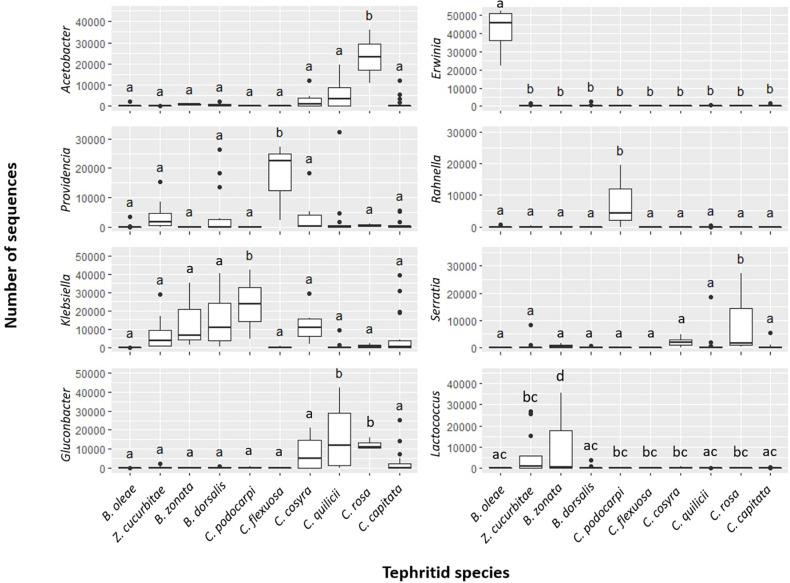
FIGURE 3.
Abundances (as estimated in number of reads; dataset B) of most representative bacterial genera in ten targeted fruit fly species. Results are reported for bacterial genera producing significant differences in at least 8 pairwise tests out of 9 (FDR-corrected p < 0.01) and contributing to > 5% of dissimilarity between groups. For each species, significance letters for pairwise tests are indicated (see also Table 4 and Supplementary Table 12).

