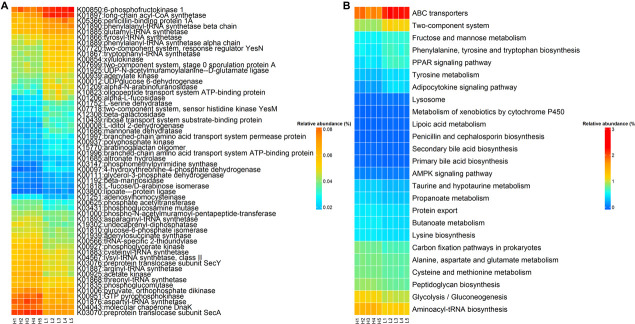
FIGURE 5.
The KEGG function terms showing different enrichments between high and low finishing weight rabbits. (A) Heat map of KOs showing different enrichments between high and low finishing weight rabbits. The X-axis shows the sample IDs, e.g., H1 representing the individual 1 with high finishing weight. (B) Heat map of KEGG pathways showing different enrichments between high and low finishing weight rabbits.

