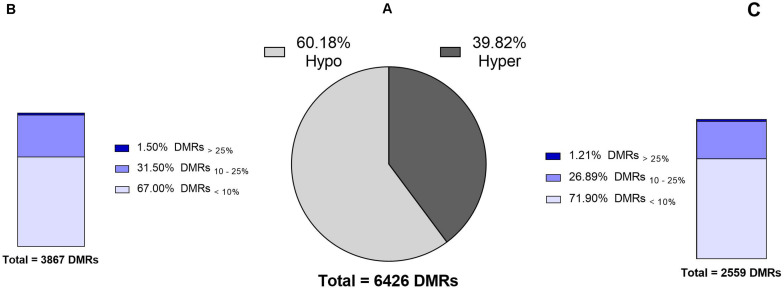
FIGURE 2.
Numbers and levels of significant DMRs identified in the sperm DNA methylome between identical 14 months old bulls (test) and 17 months old bulls (control). (A) Total number of significant DMRs indicating that 60% are hypomethylated in the test group compared to the control group. (B,C) Different levels of hypo- and hypermethylated regions in the test group compared to the control group. Explanation of percentage ranges: DMRs<10% indicating regions with less than 10% difference in DNA methylation, DMRs10–25% indicating regions having between 10 and 25% difference in DNA methylation, DMRs>25% indicating regions having over 25% difference in DNA methylation.

