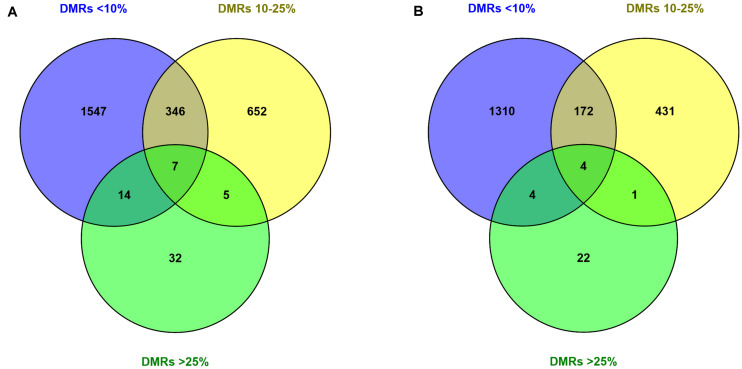
FIGURE 4.
Annotation of the filtered DMRs with varying degrees of methylation difference to the nearest TSSs. Numbers inside the circles, showing the number of closest unique TSSs (duplicated TSSs removed) to DMRs in (A) hypomethylation and (B) hypermethylation groups. Explanation of percentage ranges: DMRs<10% indicating regions with less than 10% difference in DNA methylation, DMRs10–25% indicating regions having between 10 and 25% difference in DNA methylation, DMRs>25% indicating regions having over 25% difference in DNA methylation.

