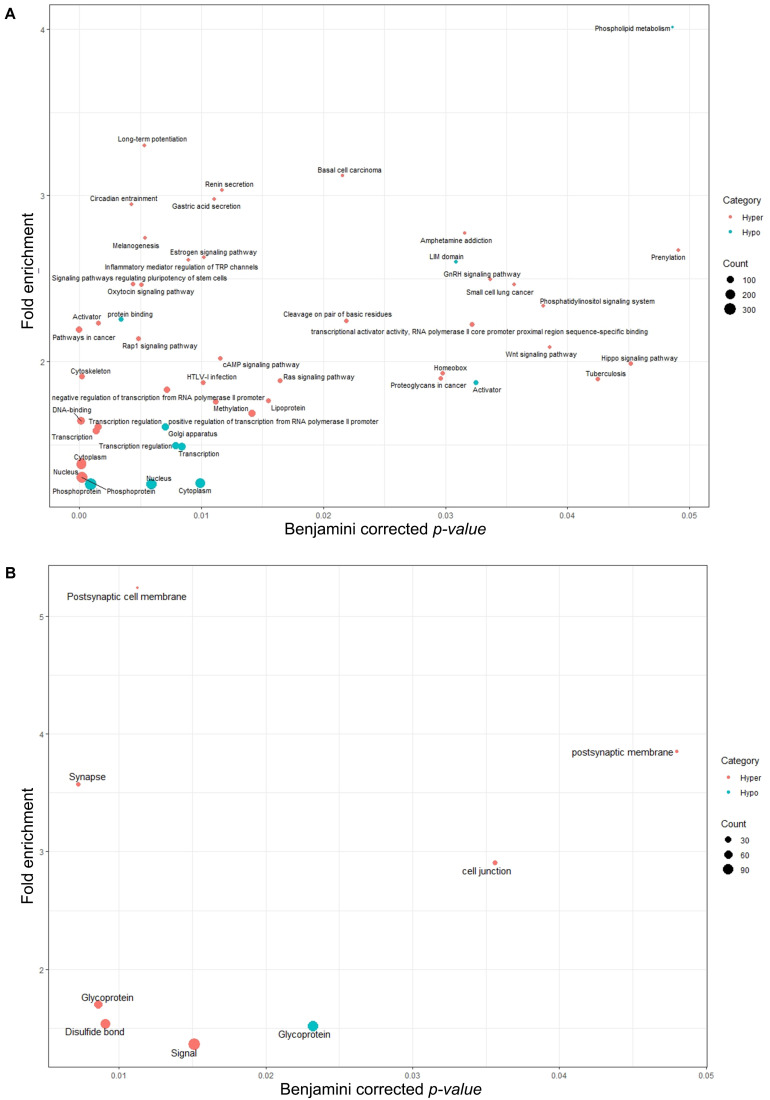
FIGURE 6.
Pathway analysis for annotated genes associated with (A) filtered DMRs with less than a 10% methylation difference and (B) filtered DMRs with a 10–25% methylation difference. No significant pathways were identified for annotated genes associated with DMRs over 25% methylation difference. GO terms are plotted in function of their Benjamini corrected p-value (x-axis) and fold enrichment (y-axis). Gene count size key shows the number of genes involved in that particular pathway. Hypo, hypomethylated regions (referring to TSSs annotated with hypomethylated regions in test group); Hyper, hypermethylated regions (referring to TSSs annotated to hypermethylated regions in test group).

