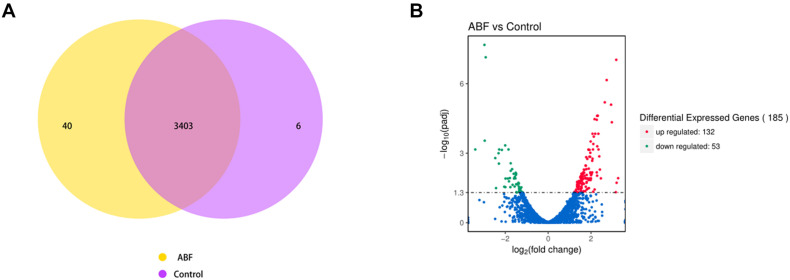
FIGURE 5.
(A) Venn diagram analysis of gene expression. The number in each circle represents the total number of genes that are expressed in each sample, and the overlapping part of circles indicates that the gene is co-expressed in both samples. (B) The volcano plots of the differentially expressed genes. Significantly differentially expressed genes were treated with red dots (up-regulated) or green dots (down-regulated). The abscissa represents fold change, and the ordinate represents statistical significance.

