FIGURE 5.
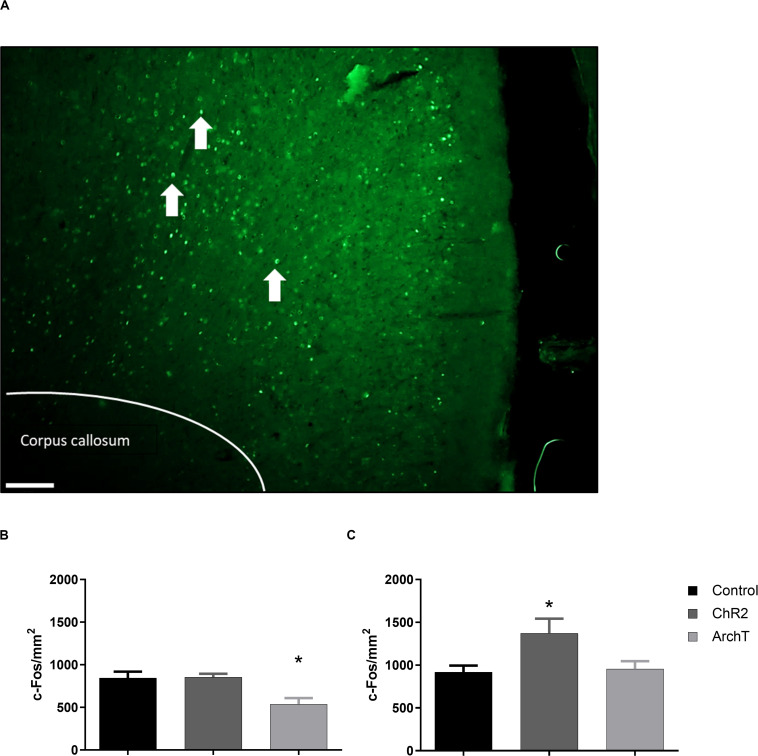
Effects of optogenetic stimulation (ChR2) or inhibition (ArchT) of glutamatergic neurons in the ACC on c-Fos positive cells in the ACC of SD rats. (A) Representative images of c-Fos (green) expression within the ACC (scale bar = 200 μm). White arrows denote representative c-Fos-positive staining. (B) Effects of optogenetic stimulation (ChR2) or inhibition (ArchT) of glutamatergic neurons in the ACC on c-Fos positive cells in the ACC of male SD rats. Data are mean ± SEM (n = 5–6 per group). *p < 0.05 vs. control. (C) Effects of optogenetic stimulation (ChR2) or inhibition (ArchT) of glutamatergic neurons in the ACC on percent of c-Fos positive cells in the ACC of female SD rats. Data are mean ± SEM (n = 4–6 per group). *p < 0.05 vs. control.

