
FIGURE 1.
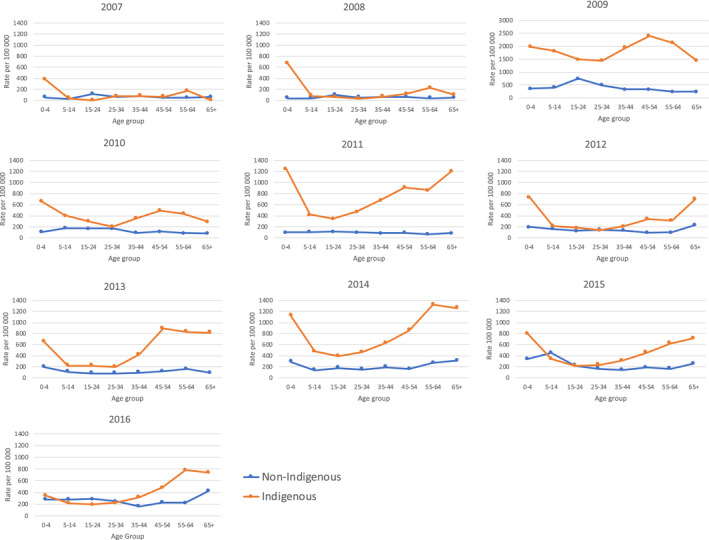
Rates of laboratory‐confirmed influenza cases per 100 000 population members in the Northern Territory from 2007 to 2016 by Indigenous status. Note case rates for 2009 presented with different scales on vertical axis
Official websites use .gov
A
.gov website belongs to an official
government organization in the United States.
Secure .gov websites use HTTPS
A lock (
) or https:// means you've safely
connected to the .gov website. Share sensitive
information only on official, secure websites.
Rates of laboratory‐confirmed influenza cases per 100 000 population members in the Northern Territory from 2007 to 2016 by Indigenous status. Note case rates for 2009 presented with different scales on vertical axis