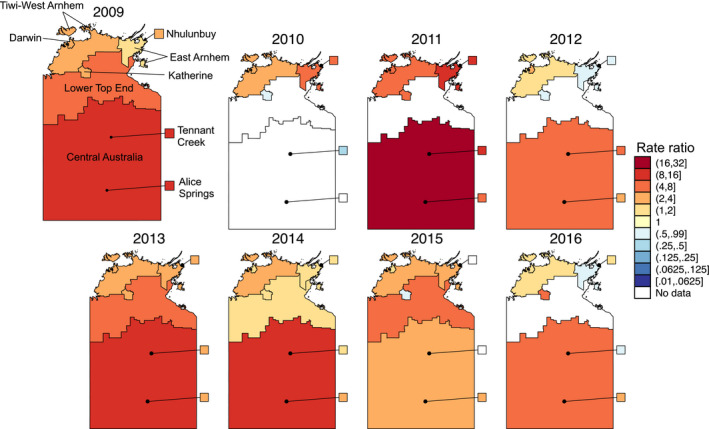
FIGURE 3.

Maps of the ratio of the rate of influenza notifications in the Indigenous population to the rate of influenza notifications in the non‐Indigenous population. Areas with < 5 total notifications or no notifications in either the Indigenous or non‐Indigenous population were considered to have no valid data for this analysis. The map of 2009 was drawn larger to allow for labels to be resolved
