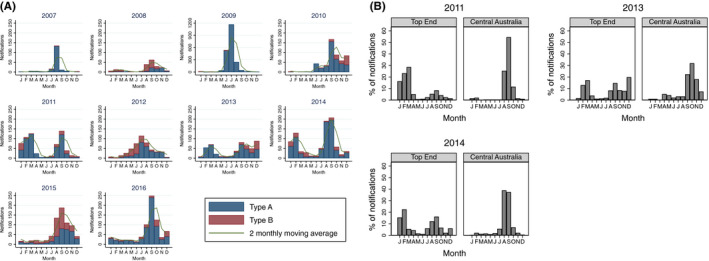
FIGURE 4.

A, Laboratory‐confirmed influenza cases in the Northern Territory by month. B, Histograms of percentage of laboratory‐confirmed influenza cases seen each month in the Top End and Central Australia regions of the Northern Territory for years in which a bimodal peak in the influenza season is seen. The total number of laboratory‐confirmed influenza cases for each of these years was 2011‐Top End 447, Central Australia: 189; 2013‐Top End 407, Central Australia: 94; 2014‐Top End 543, Central Australia: 318
