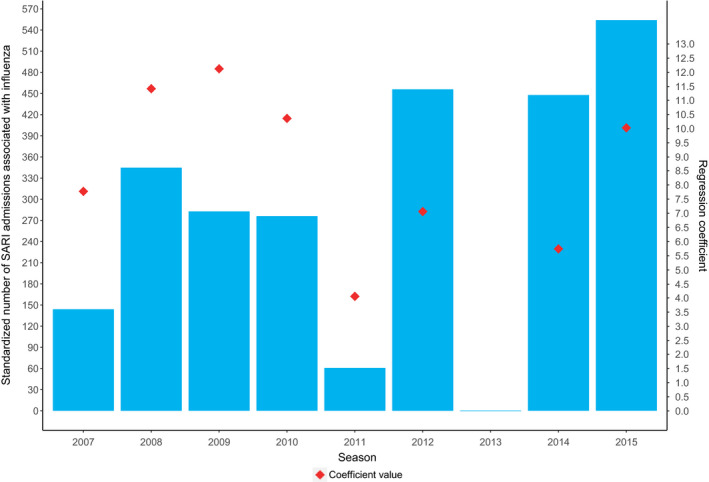
Figure 5.

Standardized† number of SARI admissions associated with influenza and regression coefficients per season‡ (2007/8‐2015/16) in the Netherlands. †Standardized to the total number of medical ICU admissions in season 2015/2016. ‡ Each season representing the time period of July until June the next year (eg 2007 representing 2007/2008 season)
