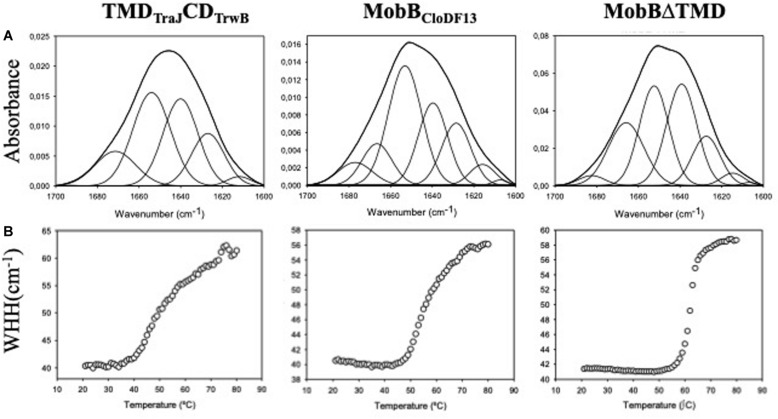
FIGURE 2.
(A) Amide I region of the infrared spectra of TMDTraJCDTrwB, MobBCloDF13, and MobBΔTMD. Proteins were purified, dialyzed against the corresponding buffer in D2O and analyzed by IR spectroscopy as explained in “Materials and Methods” section. Obtained spectra were curve-fitted to show the different secondary structure components as detailed in Table 5. (B) Thermal denaturation of TMDTraJCDTrwB, MobBCloDF13, and MobBΔTMD as seen by IR spectroscopy. The widths at half-height (WHH) of the amide I bands are plotted as a function of temperature (°C). Thermal denaturation is marked by an abrupt increase in bandwidth. Mid-point denaturation temperature (Tm) values corresponding to each protein are detailed in Table 5.

