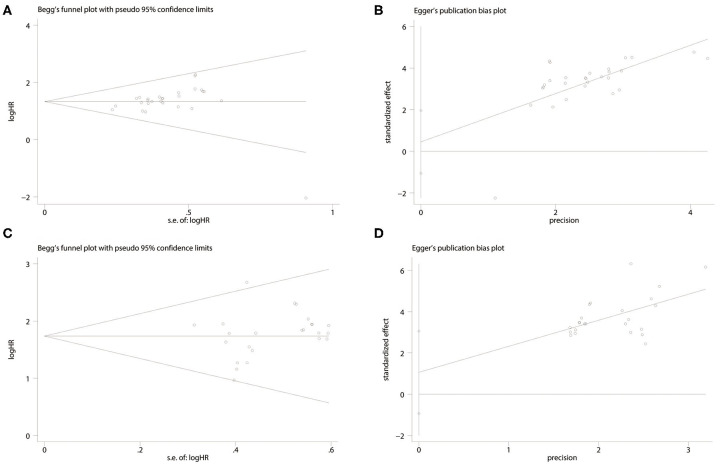
Figure 5.
Forest plot of the publication bias. (A) Begg's funnel plot of publication bias for the association between miRNA low expression and poor prognosis. (B) Egger's test of publication bias for the association between miRNA low expression and poor prognosis. (C) Begg's funnel plot of publication bias for the association between miRNA high expression and poor prognosis. (D) Egger's test of publication bias for the association between miRNA high expression and poor prognosis.

