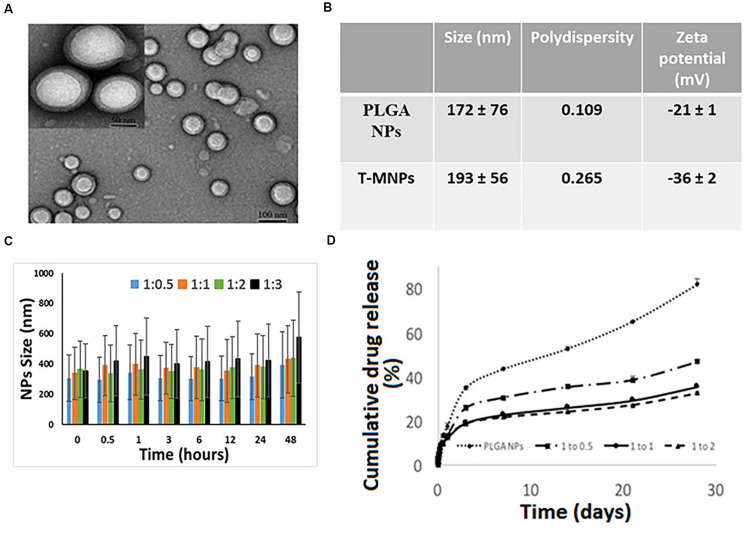
FIGURE 1.
Characterization of T-MNPs. (A) TEM images of T-MNPs at 1:2 NP to membrane protein weight ratio. (B) Size, polydispersity and zeta potential of PLGA NPs and T-MNPs analyzed using Dynamic Light Scattering (DLS). (C) Stability of T-MNPs in 0.9% saline (at varying NP to membrane protein weight ratios: 1:0.5, 1:1, 1:2, and 1:3) evaluated by change in NPs size over a 2-day period using DLS. (D) Cumulative% drug release from T-MNPs (varying NP to membrane protein ratios of 1:0.5, 1:1, 1:2 versus PLGA NPs) performed in phosphate buffered saline over 28 days. Samples were analyzed using UV-vis spectrophotometer.

