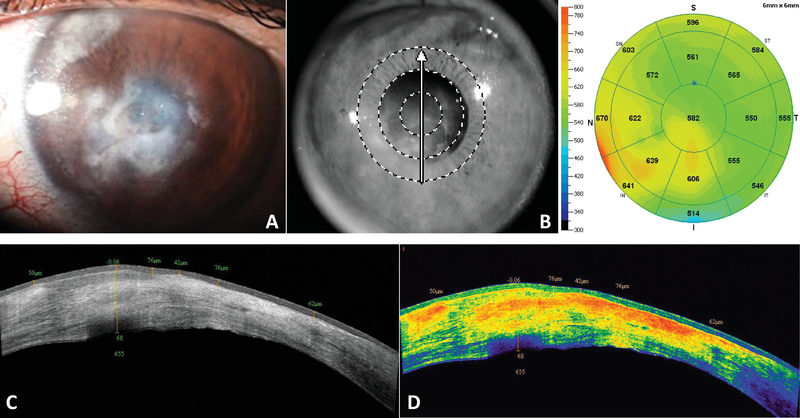
Figure 1.

(A) Slit-lamp photograph of a cornea with active necrotizing HSK showing stromal inflammatory infiltration and edema. (B) SD-OCT pachymetry map showing a thickened cornea (max = 670 µm) corresponding to the area with stromal edema. (C) A cross-sectional view of the central lesion showing areas of epithelial thickening (max = 76 µm) over inflammatory infiltrates, corresponding to areas of hyperreflectivity, and hypodense areas, corresponding to stromal edema. (D) Color scale of the same lesion showing the inflammatory infiltrates and scarring in warm (orange to yellow) tones.
