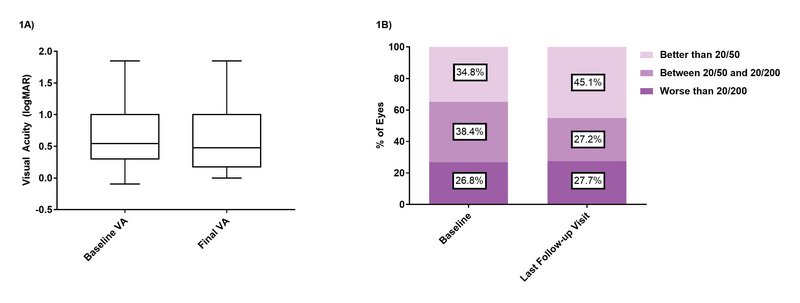
Figure 1.

Comparison of mean visual acuity between baseline and last visit. Figure 1A shows boxplot comparisons between baseline and final visual acuities. Figure 1B shows the percentage of patients in each visual acuity category by the last follow-up visit compared to baseline.
