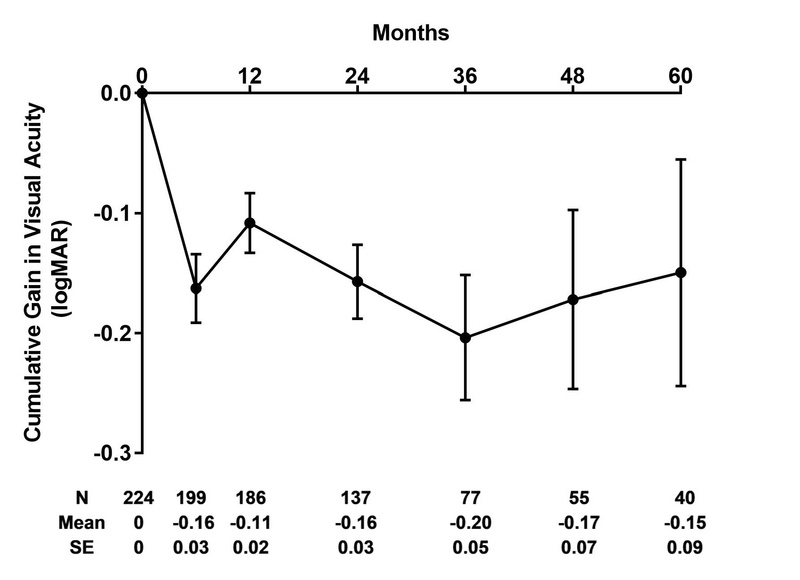
Figure 2.

Cumulative gain in logMAR over treatment course (Mean SE). Visual acuities recorded during patients' treatment visits were compared with the visual acuity at baseline. Only those patients actively continuing to receive injections were included in this figure; patients who discontinued injections after a specific time were not included in subsequent time points in this graph.
