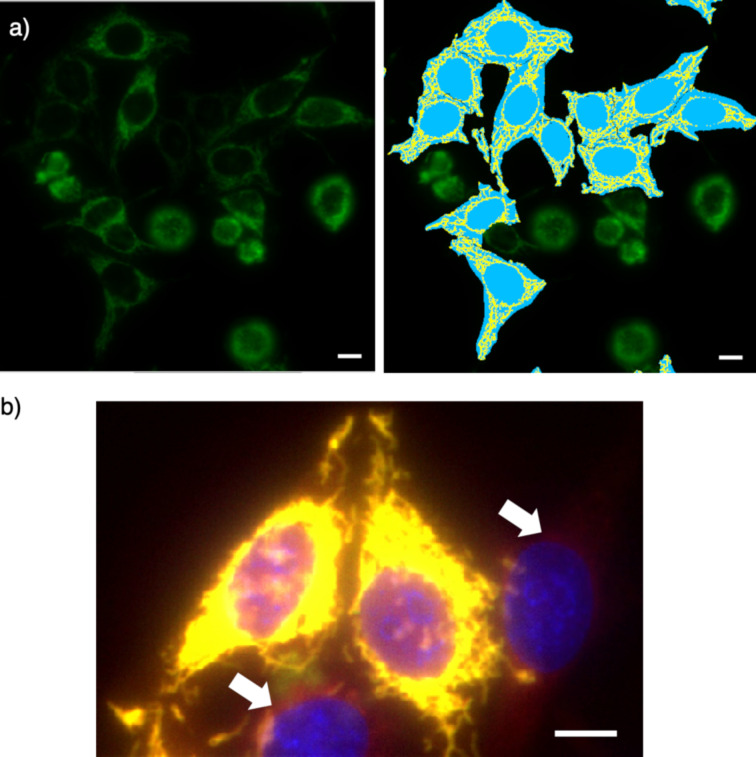
Figure 7.
Examples from the automated HC imaging of stable HGM cells with HaloTag–GFP on mitochondria, labeled with 26 and Hoechst dye. a) GFP channel (left) and cell selection (right), showing the cell body mask (light blue areas) and the mitochondrial mask (yellow areas). b) Overlay image of the GFP (green), 26 (red), and the Hoechst dye (blue) channels, showing off-target fluorescence from 26 (white arrows). Scale bar: 10 µm.

