FIG 9.
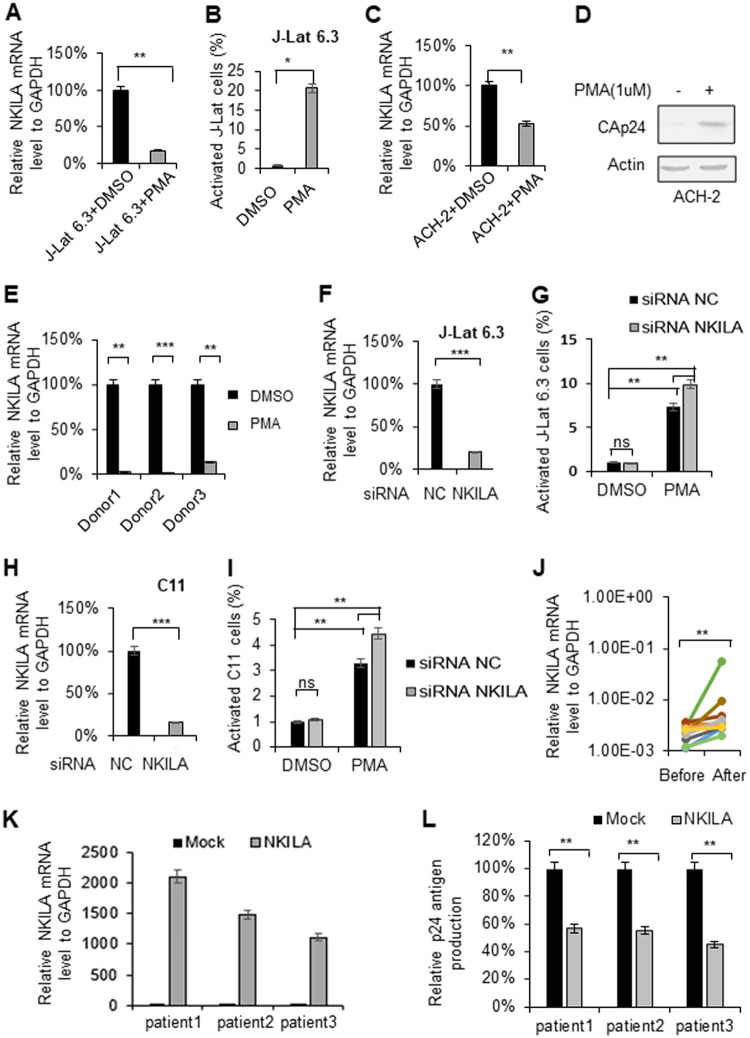
NKILA is downregulated when latent cells are activated. Reactivation of latent HIV-1 increased NKILA expression. HIV-1 latently infected J-Lat 6.3 Jurkat cells and CD4+ CEM cells (ACH-2) were utilized to measure the change in NKILA expression during viral reactivation. J-Lat 6.3 (A) or ACH-2 (C) cells were treated with or without PMA (1 μM) for 48 h and were then harvested. mRNA was extracted from the cells for measurement of NKILA expression by qRT-PCR, and the expression levels were normalized to that of GAPDH. (B) HIV-1 reactivation in J-Lat 6.3 cells was measured by detecting GFP-positive cells by flow cytometry. The corresponding value of GFP-positive cells treated with dimethyl sulfoxide (DMSO) was set as 1 or 100% as appropriate. (D) HIV-1 reactivation of ACH-2 cells was measured by IB analysis with anti-CAp24. (E) PMA treatment decreased the NKILA levels in primary CD4+ T cells from HIV-1 infected patients with cART treatment. (F to I) Knockdown of NKILA increased HIV reactivation from latency. siRNA NKILA or siRNA NC was transfected into HIV-1 latently infected C11 and J-Lat 6.3 cells. Forty-eight hours posttransfection, cells were harvested for assessment of NKILA expression by qRT-PCR (F and H) and were stimulated with PMA for 48 h for detection of the GFP-positive cells by flow cytometry (G and I). The corresponding value of GFP-positive cells treated with DMSO was set as 1 or 100% as appropriate. (J) Successful cART treatment increased NKILA expression in PBMCs of HIV-1 infected patients. PBMCs were collected from HIV-1-infected individuals pretherapy and after 48 weeks of cART therapy. mRNA was extracted from PBMCs for measurement of NKILA expression levels by qRT-PCR. (K and L) Overexpression of NKILA in CD4+ T cells caused inhibition of reactivation of HIV-1. The CD4+ cells from three patients who had undergone HAART treatment were nucleofected with NKILA or control vector. Forty-eight hours posttransfection, NKILA mRNA levels were analyzed by qRT-PCR (K), and phytohemagglutinin M (PHA-M, 5 ng/ml) was added to the cell supernatants for 7 days. (L) The supernatant p24 antigen was analyzed by ELISA. The results are representative of three independent repeats. The qRT-PCR results in panels A, C, E, F, H, J, K, and L are shown as the corresponding values, with the value in the mock group set as 100%. The data are presented as the means ± SDs. *, P < 0.05; **, P < 0.01; ***, P < 0.001 (unpaired t test).

