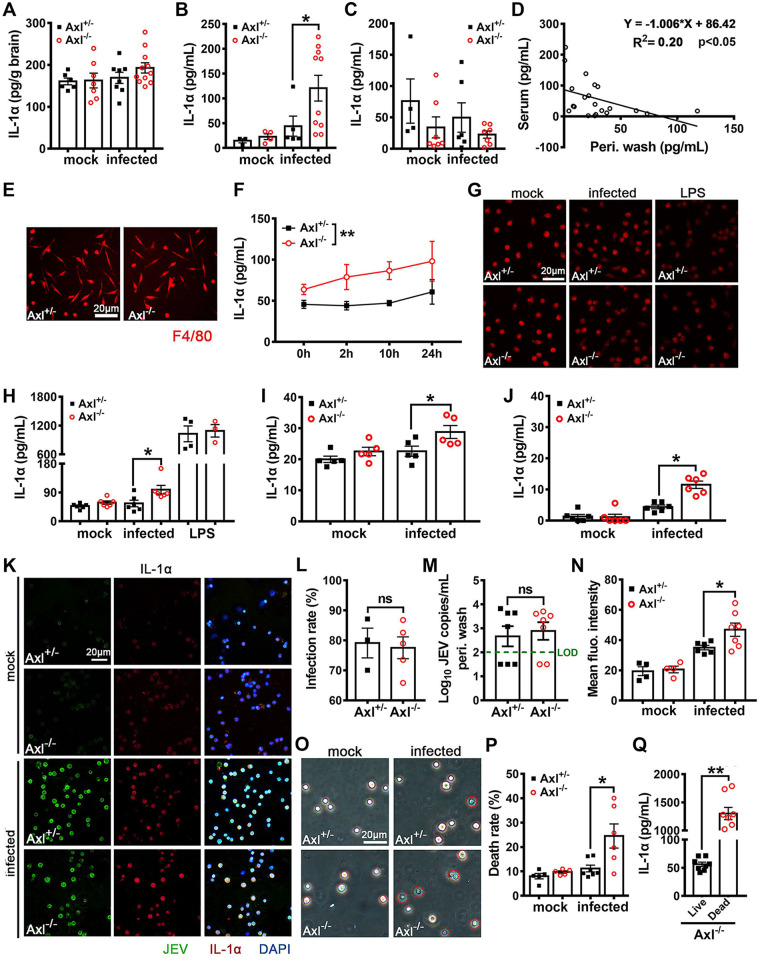
FIG 10.
Effect of Axl on IL-1α production during JEV infection. (A to D) Four-week-old Axl−/− and Axl+/− mice received an i.p. injection of 104 PFU of JEV. IL-1α content in the brain (A), serum (B), and peritoneal wash (C) at 24 hpi; each dot denotes a mouse, and the data were compared by unpaired t test. (D) Correlation analysis of IL-1α content in serum and peritoneal wash at 24 hpi; the data were analyzed by linear regression model. (E to H) Peritoneal macrophages were isolated from Axl−/− and Axl+/− mice, cultured, and infected with JEV (MOI = 1) or stimulated with LPS (1 μg/ml) in vitro. (E) IF staining of F4/80 (marker of macrophages) in untreated Axl−/− and Axl+/− peritoneal macrophages. Scale bar = 20 μm. (F) Dynamics of IL-1α contents in the supernatants of peritoneal macrophages; n = 4 for each group, and the data were compared by two-way ANOVA. (G) IF staining of intracellular IL-1α in peritoneal macrophages at 24 hpi. Scale bar = 20 μm. (H) IL-1α contents in the supernatants of peritoneal macrophages at 24 hpi; n = 3 to 6 for each group, and the data were compared by unpaired t test. (I and J) Murine cerebral microvascular endothelial cells (bEND.3) and primary splenocytes were infected with JEV (MOI, 1). (I) IL-1α contents in the supernatants of bEND.3 cells at 24 hpi; n = 5, and the data were compared by unpaired t test. (J) IL-1α contents in the supernatants of primary splenocytes at 24 hpi; n = 6, and the data were compared by unpaired t test. (K) IF staining of JEV antigens and IL-1α inside the in situ peritoneal macrophages at 24 hpi. Scale bar = 20 μm. (L) Infection rates of the in situ peritoneal macrophages at 24 hpi; n = 3 for Axl+/−, and n = 5 for Axl−/−; the data were compared by unpaired t test. (M) Viral loads in peritoneal washes at 24 hpi; n = 7 for each group, and the data were compared by unpaired t test. (N) IF staining intensity of intracellular IL-1α in the in situ peritoneal macrophages at 24 hpi; n = 4 to 7 for each group, and the data were compared by unpaired t test. (O) Trypan blue staining of the in situ peritoneal macrophages at 24 hpi. Scale bar = 20 μm. (P) Cell death rates of the in situ peritoneal macrophages at 24 hpi; n = 5 to 7, and the data were compared by unpaired t test. (Q) IL-1α content in the supernatant of live and hypotonically dead Axl−/− peritoneal macrophages; n = 8 for each group, and the data were compared by unpaired t test. All the data are expressed as the means ± SEM; *, P < 0.05; **, P < 0.01; ns, no significance (P > 0.05); each result is the representative of three independent experiments.

