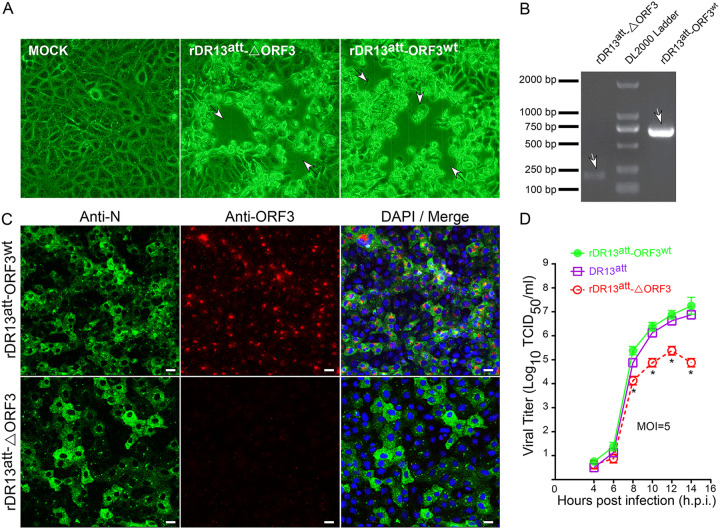
FIG 2.
Characterization of the recombinant PEDVs. (A) Cytopathic effect (arrows) in Vero cells infected with the recombinant viruses. Images were taken at 40 h.p.i. using an inverted microscope at a magnification of ×200. (B) RT-PCR verification of recombinant viruses rDR13att-ORF3wt and rDR13att-ΔORF3. RT-PCR was performed across the ORF3 region (primers 1/3R [Table 3]) using the isolated viral RNAs as the template, and the products were analyzed by agarose gel electrophoresis. Arrows point at the relevant bands, the predicted sizes of which are 191 nt and 725 nt for the left and right lanes, respectively. (C) Indirect immunofluorescence analysis of N protein and ORF3 protein expression in Vero cells infected with rDR13att-ORF3wt and rDR13att-ΔORF3. Cells were inoculated at an MOI of 0.1 and incubated for 24 h. They were then fixed and permeabilized, and an immunofluorescence analysis was performed to detect ORF3 (red) and N protein (green) with rabbit anti-ORF3 (P71-3; 1:50) and mouse anti PEDV N monoclonal antibody (3F-12; 1:100), respectively. Cell nuclei were stained with DAPI (blue). Separate images showing N protein expression, ORF3 protein expression, and a merger of both were acquired as indicated. Scale bar represents 50 μm. (D) One-step growth kinetics of rPEDVs and DR13att in Vero cells. Vero cells were infected with rDR13att-ORF3wt, rDR13att-ΔORF3, and DR13att at the indicated times postinfection (MOI = 5). Cells and culture media were harvested by three rounds of freezing and thawing, followed by centrifugation to remove cell debris. Supernatants were used to measure viral titers. Results are expressed as the mean values from at least three parallel tests, and error bars represent standard deviations. Statistical significance is indicated by asterisks as follows: *, P < 0.05.

