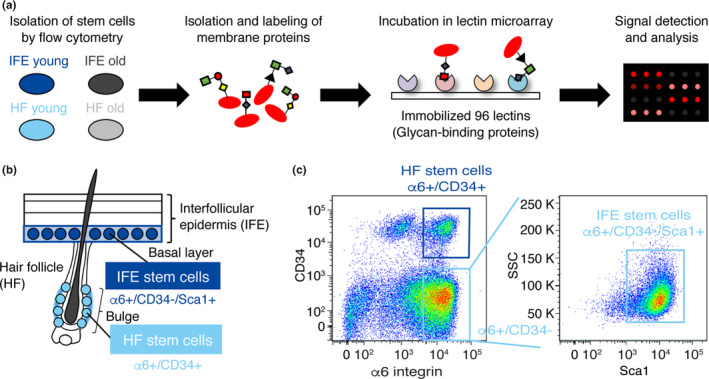
FIGURE 1.

Schematic representation of lectin microarray using freshly isolated epidermal stem cells. (a) Schematic representation of lectin microarray analysis. Hydrophobic fractions containing membrane proteins are isolated, fluorescently labeled, and incubated with lectin microarray, in which 96 lectins are immobilized on glass slides. The lectin–glycan interactions are measured and quantified as signal intensities obtained from each lectin spot. (b) A schematic representation of epidermal cell types in mouse skin and cell surface markers used. (c) Flow cytometry dot plot and sorting gates for the isolation of skin epidermal subpopulations. Interfollicular epidermal (IFE) stem cells are defined as ⍺6‐integrin+/CD34−/Sca1+, and hair follicles (HF) stem cells are defined as ⍺6‐integrin+/CD34+.
