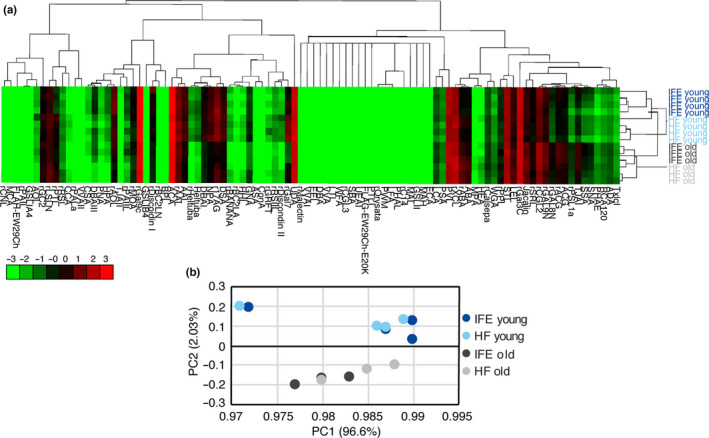
FIGURE 2.

Glycome analysis of young and old epidermal stem cells. (a) Heat map and hierarchical clustering of lectin microarray signals. Each row represents different stem cell populations isolated from an individual mouse (N = 4 for young mice, N = 3 for old mice). Ninety‐six lectins are shown on columns. (b) Principal component analysis of the mean normalized signals obtained from lectin microarray. A scatter plot for principal component (PC) 1 and 2 is shown. Each dot represents the sample derived from an individual mouse. Different cell types are indicated by color.
