FIGURE 5.

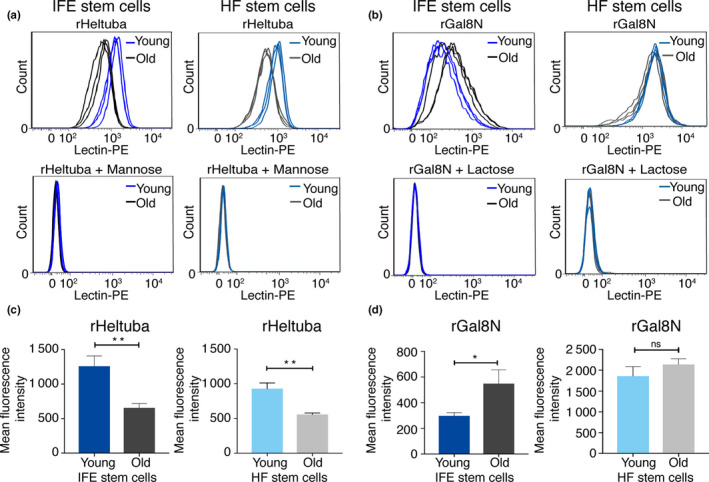
The rHeltuba and rGal8N lectins differentially bind to freshly isolated young and old stem cells. (a, b) The histogram shows signal intensities of PE‐labeled rHeltuba (1 µg/ml) (a) or rGal8N (10 µg/ml) (b) in the interfollicular epidermis (IFE) and hair follicles (HF) detected by flow cytometry. N = 3 for young and old mice. Data from each mouse are shown as an individual line. For inhibition of rHeltuba and rGal8N, 0.1 M mannose or 0.1 M lactose is used, respectively. (c, d) Quantification of mean fluorescence intensity obtained by flow cytometry. Data are shown as means ± SD. Statistical analysis is performed using the unpaired Student's t test. **p < 0.01. *p < 0.05. ns: not significant; rGal8N in HF stem cells, p = 0.1412.
