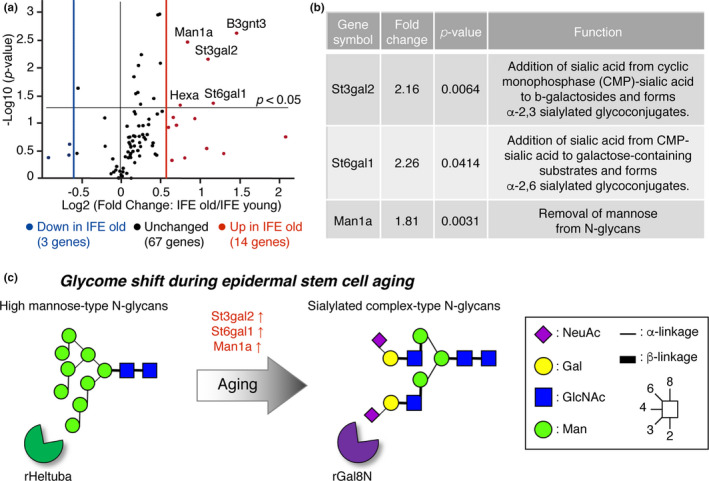
FIGURE 6.

Gene expression analysis of glycosylation‐related genes using RT2 Profiler PCR array. (a) The volcano plot represents fold change and p‐values on x‐ and y‐axis, respectively. The vertical red and blue lines represent a fold‐change cutoff of ≥1.5. N = 3 for young mice, N = 3 for old mice. Also, see Table S2. (b) Lists of differentially expressed sialyltransferase and mannosidase genes. (c) Schematic representation of the putative glycan changes during epidermal stem cell aging.
