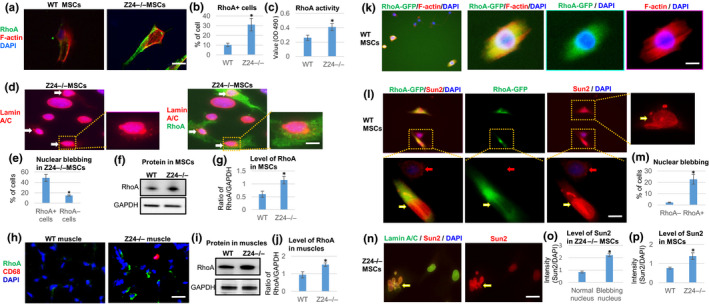
Figure 3.

Increased RhoA activation in Z24 −/− MSCs, and effect of RhoA over‐expression on Sun2 and nuclear blebbing in WT MSCs. (a) Immunostaining analysis of RhoA and F‐actin in WT and Z24 −/− MSCs. Scale bar = 30 µm. (b) Quantification of RhoA+ cells is shown. (c) Quantification of RhoA activity is shown. (d) Immunostaining analysis of RhoA and lamin A/C in Z24 −/− MSCs. Arrows: cells with higher RhoA expression and nuclear blebbing. Scale bar = 5 µm. (e) Quantification of nuclear blebbing in RhoA+ and RhoA‐ Z24 −/− MSCs is shown. (f, g) Western blot analysis and quantification of RhoA in WT and Z24 −/− MSCs, with GAPDH as loading control. (h) Immunostaining analysis of RhoA+ cells and CD68+ inflammatory cells in skeletal muscle of Z24 −/− mice. (i, j) Western blot analysis and quantification of RhoA in muscle tissues from WT and Z24 −/− mice, with GAPDH as loading control. (k) WT MSCs were transfected with a plasmid carrying constitutively active RhoA‐GFP and stained for F‐actin. Scale bar = 5 µm. (l) Immunostaining analysis of Sun2 to check Sun2 and nuclear blebbing in RhoA‐GFP transfected WT MSCs. Yellow arrows: cells with RhoA‐GFP; red arrows: cells without RhoA‐GFP. Scale bar = 5 µm. (m) Quantification nuclear blebbing (RhoA‐GFP‐ V.S. RhoA‐GFP+ cells) is shown. (n) Immunostaining analysis of Sun2 and lamin A/C in Z24 −/− MSCs. Scale bar = 10µm. (o) Quantification of Sun2 in Z24 −/− MSCs without or without nuclear blebbing is shown. (p) Quantification of Sun2 in WT and Z24 −/− MSCs is shown. N ≥ 6. “*” at bar charts indicates p < .05
