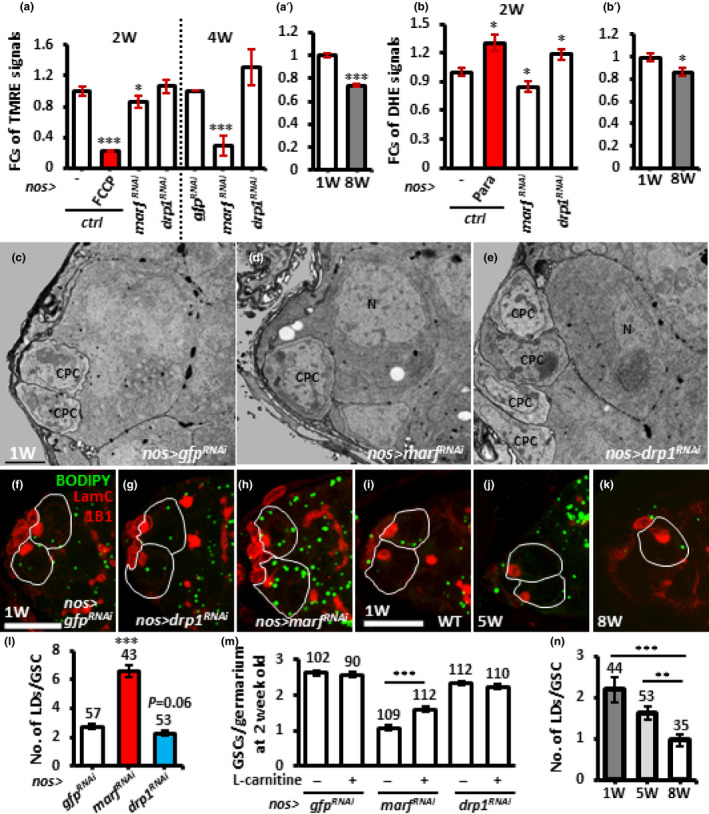
FIGURE 5.

marf‐knockdown and aged GSCs display unhealthy mitochondria and reduced cellular ROS levels, while only marf‐knockdown GSCs exhibit oil accumulation. (a) Fold changes (FCs) of TMRE signals in isolated bam1/bam△86 GSCs with indicated genotypes at 2 and 4 weeks after eclosion with or without FCCP treatment. (a′) FCs of TMRE signals in isolated bam1/bam△86 GSCs of 1‐ and 8‐week‐old flies. (b) FCs of DHE signals in isolated bam1/bam△86 GSCs with indicated genotypes 2 weeks after eclosion with or without paraquat treatment. (b′) FCs of DHE signals in isolated bam1/bam△86 GSCs of 1‐ and 8‐week‐old flies. Each experiment was repeated 6 times, except TMRE analysis at 4 weeks was repeated 4 times. (c–e) Representative electron micrographs showing the anterior regions of 1‐week (w)‐old nos > gfpRNAi (c), nos > marfRNAi (d), and nos > drp1RNAi germaria (e). GSCs are identified as the large cells directly contacting cap cells (CpCs). N, nucleus. Asterisks indicate oil droplets. Scale bar, 1 μm. (f‐l) One‐week (w)‐old nos > gfpRNAi (f) nos > marfRNAi (g), nos > drp1RNAi (h), wild‐type (WT) (i), 5‐ (j) and 8‐week‐old germaria (k) stained for LamC (red, cap cell nuclei), 1B1 (red, fusomes), and BODIPY (green, natural oil). GSCs are outlined with solid lines. Scale bar, 10 μm. (l) Number (no.) of lipid droplets (LDs) in 1‐week‐old GSCs with indicated genotypes with or without L‐Carnitine treatment. (m) Average GSCs per germarium of 1‐week‐old flies with indicated genotypes with or without treated L‐Carnitine treatment. (n) Number of lipid droplets in 1‐, 5‐ and 8‐week‐old wild‐type (WT) GSCs. Numbers of analyzed GSCs are shown above each bar. *p < 0.05; **p < 0.01; ***p < 0.001. Error bars, mean ± SEM. Scale bar, 10 μm.
