FIGURE 6.

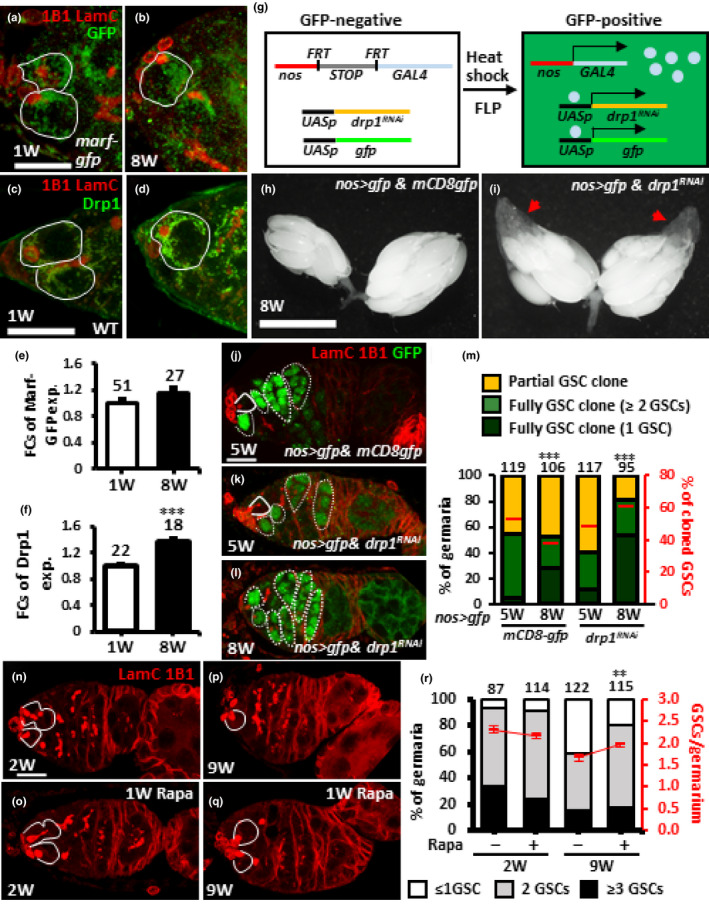
Suppression of Drp1 expression or promotion of autophagy in aged GSCs delays GSC removal from the niche. (a and b) One‐ (a) and 8‐week (W)‐old germaria (b) bearing marf‐gfp with 1B1 (red, fusomes), LamC (red, cap cell nuclear envelopes), and GFP (green, Marf) labeling. (c and d) One‐ (c) and 8‐week‐old wild‐type (WT) germaria (d) with 1B1 (red), LamC (red) and GFP (green, Drp1) labeling. (e and f) Fold changes (FCs) of Marf‐GFP (e) in marf‐gfp flies and Drp1 (f) in wild‐type flies at 1 and 8 weeks old. (g) A flip‐out system was used for nos‐gal4‐driven drp1 knockdown in aged GSCs; knockdowns are identified by the presence of GFP expression. In females carrying a nos promoter‐driven FRT‐flanked flip‐in GAL4/VP16 construct (nos > STOP > GAL4), GAL4 is not expressed, preventing expression of UAS‐gfp and UAS‐drp1RNAi. GAL4 expression is turned on by removing the stop cassette through Flippase‐mediated recombination, which in turn activates expression of UAS‐gfp and UAS‐drp1RNAi. (g and i) 8‐week‐old nos>gfp &mCD8gfp (g) and nos>gfp & drp1RNAi mosaic ovaries (i) were heat‐shocked at 4 weeks old for 3 days to activate nos‐GAL4. Red arrows point to previtellogenic egg chambers. (j–l) 5‐week‐old nos>gfp &mCD8gfp (i), nos>gfp and drp1RNAi (j) and 8‐week‐old nos>gfp and drp1RNAi mosaic germaria (l) heat‐shocked at 4 weeks old for 3 days with LamC (red), 1B1 (red), and GFP (green, cloned cells) labeling. (m) Percentage (%) of 5‐ or 8‐week‐old germaria (Left y‐axis) carrying partial or full GSC clones (containing 1 or ≥2 GSCs) from flies with indicated genotypes heat‐shocked at 4 weeks old. Right y‐axis shows percentage of GFP‐positive GSCs in flies with indicated genotypes. (n–q) Two‐ and 9‐week‐old germaria with or without rapamycin treatment for 1 week labeled with LamC (red) and 1B1 (red). (r) Percentage of germaria with indicated GSC number of 2‐ and 9‐week‐old flies fed with or without rapamycin, beginning at 1 and 8 weeks after eclosion, respectively. Solid lines outline GSCs and dashed lines outline GSC progeny. Numbers of analyzed GSCs are shown above each bar. *p < 0.05; **p < 0.01; ***p < 0.001. Error bars, mean ± SEM. Scale bars in a, c, j and n are 10 μm; bar in h is 0.5 mm.
