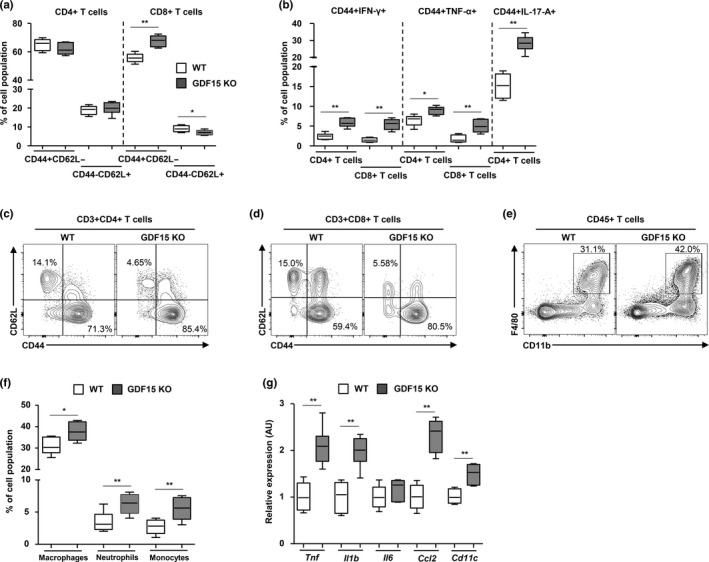
Figure 5.

GDF15‐mediated regulation of the inflammatory response in the liver and gonadal adipose tissues during aging. (a) Population size and frequency of CD44+CD62L− and CD44−CD62L− in CD4+, and CD8+ T cells in liver tissues of 20‐month‐old WT (n = 6) or Gdf15 KO (n = 6) mice. (b) IFN‐γ, TNF‐α, or IL‐17A producing CD4+ and CD8+ T cells in liver tissues of 20‐month‐old WT (n = 6) or Gdf15 KO (n = 6) mice. (c,d) Representative flow cytometry plots of CD44+CD62L− and CD44−CD62L− in CD4+, and CD8+ T cells in liver tissues of 20‐month‐old WT (n = 6) or Gdf15 KO (n = 6) mice. (e) Percentage of CD11b and F4/80‐positive cells within the livers of 20‐month‐old WT and Gdf15 KO mice. (f) Frequencies of infiltrating macrophages, monocytes, and neutrophils in liver tissues of WT (n = 6) or Gdf15 KO (n = 6) mice. (g) Transcript levels of pro‐inflammatory cytokines in liver tissues of WT (n = 6) or Gdf15 KO (n = 6) mice. Data are expressed as mean ± SEM. *p < 0.05, **p < 0.01 ((a,b,f,g): two‐tailed t tests)
