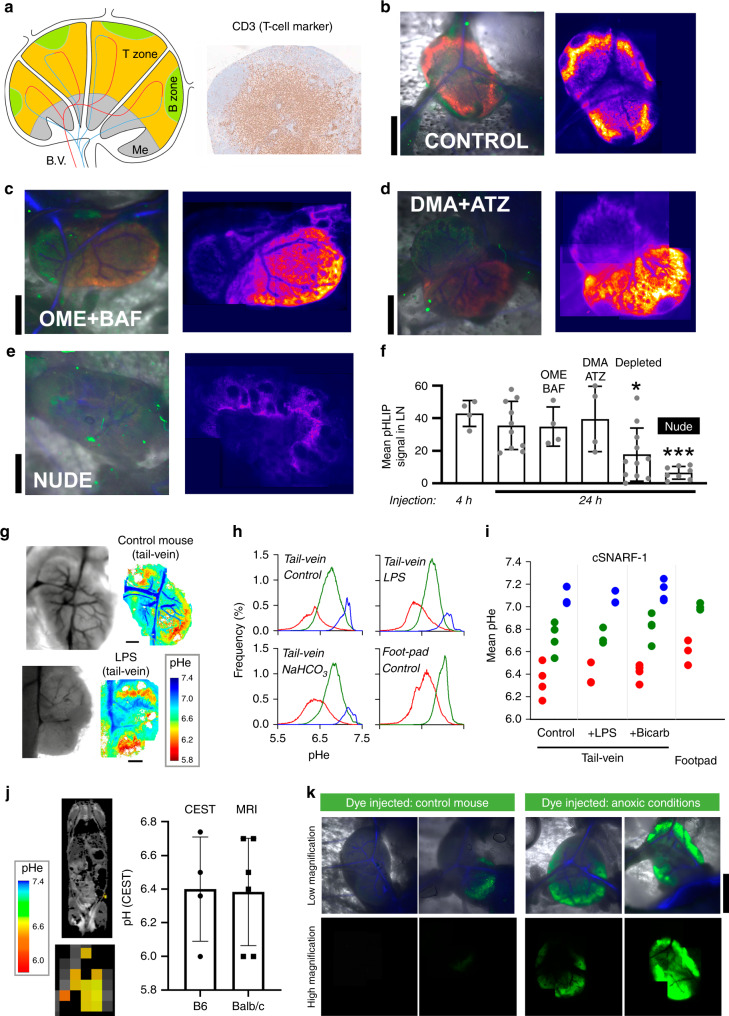
Fig. 1. Extracellular spaces of lymph node paracortical zones are acidic.
a Cartoon of lymph node (LN) showing zones occupied by T and B cells, blood vessels (B.V.) and the medulla (Me). Histological section of inguinal LN showing T-cell marker CD3 in paracortical zone (N = 3). b B6 mouse injected with pHLIP (40 µM in 60 µl) into footpad, followed by intravital imaging of inguinal LN 24 h later in window chamber. Left: composite image collected with ×1.6 objective for pHLIP-Cy5.5 (red; excited at 633 nm), autofluorescence (green; excited at 514 nm) and vasculature (blue; determined from transmission images). Right: montage of pHLIP fluorescence collected in overlapping fields of view with ×10 objective, summed across the depth of the LN (n = 10 mice). Experiment repeated on B6 mouse injected via the intraperitoneal cavity with c 200 µl of 12.5 mg/kg omeprazole (OME) and 1 mg/kg of bafilomycin (BAF) (n = 4). or d 200 µl of 5.2 mg/kg (5-N,N-dimethyl)amiloride (DMA) and 3.9 mg/kg acetazolamide (ATZ) 24 h prior to imaging (n = 3). e Experiment performed on athymic nude mouse, with same imaging settings, showing absence of pHLIP signal (n = 8). f Summary data for mean pHLIP fluorescence within LN boundary. Significance tested by one-way ANOVA with multiple comparisons (N = 5, 10, 4, 4, 8, 11); two sided at 5% significance. p-values compared to control: Depleted: P = 0.0237, Nude: P = 0.0004. g Intravital imaging of pH-sensitive cSNARF1 fluorescence in inguinal LN. Mice were injected with 70 kDa dextran-conjugated cSNARF1 into the tail-vein (20 mg/ml in 100 µl). Measurements on control mice, or mice treated with LPS (n = 4). h Statistical distribution of pHe data analyzed by Gaussian mixed models to separate pixels into clusters, representing compartments. Plots shows the pH-distribution in each of the LN compartments, averaged for all LNs. Note that compared to footpad injections, tail-vein injections detect an additional compartment corresponding to blood vessels. i Summary data for each LN compartment from 4, 3, 4, 3 LNs, respectively. j MRI-CEST pH imaging of control (B6) mice injected via i.v. with a 300 µl bolus of Isovue 370. pHe maps in inguinal LN region-of-interest are overlaid on anatomical T2-weighted images. Mean ± SEM pHe measured in B6 (n = 6) and BALB/c (n = 5) mice. k Intravital imaging for hypoxic regions using 12.5 nmoles of ImageIT-Green hypoxic probe injected into B6 mice via the footpad in a 50 µl volume. As a positive control, LNs were made anoxic by bubbling PBS with N2 and including the O2-scavenger dithionite (1 mM), followed by cessation of circulation by cervical dislocation. Upper panels: composite image collected with ×1.6 objective for ImageIT-Green (green; excited at 514 nm) and vasculature (blue; determined from transmission images). Bottom panels: montage of ImageIT-Green fluorescence collected in overlapping fields of view with ×10 objective, summed across the depth of the LN (N = 10 control and 10 anoxia). (Scale bars = 1.0 mm for b–e, k; 0.5 mm for g).

