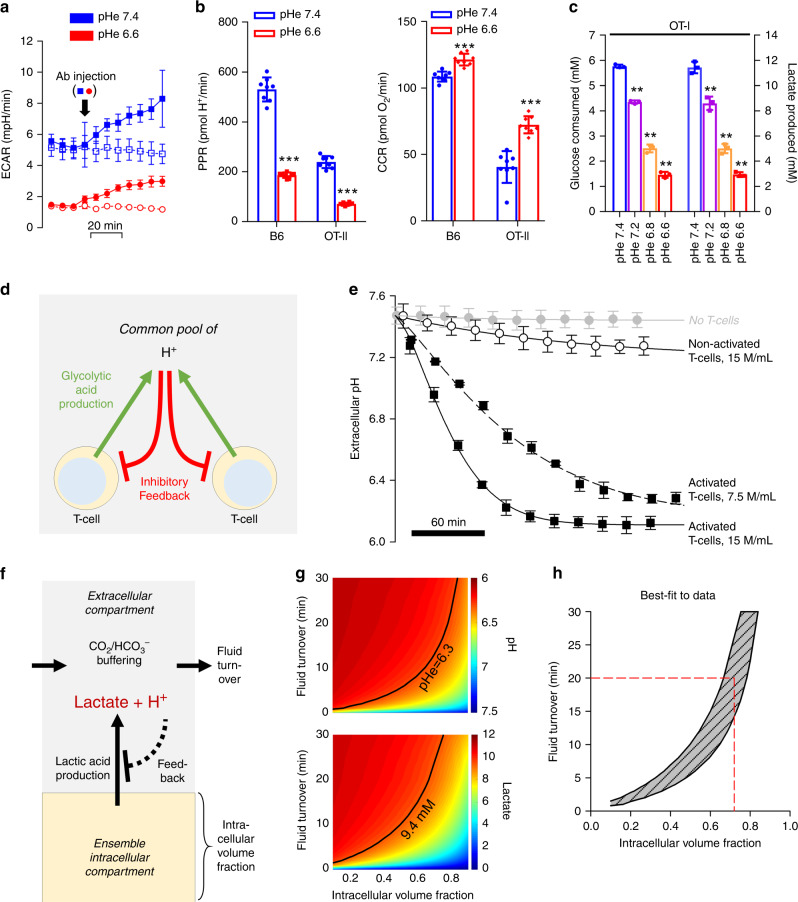
Fig. 2. Feedback regulation of T-cell glycolysis by pH establishes an acidic extracellular milieu at the steady-state.
a Time course of extracellular acidification rate (ECAR) was measured by Seahorse in B6 T-cells (Mean ± SD, n = 7 biological samples.). Injection of activating antibody (or vehicle for control) at 20 min evoked an increase in ECAR, due to the activation of T-cell glycolysis. b Proton production rate (PPR) measured by Seahorse in B6 or OT-II T-cells is reduced under acidic conditions. In paired experiments on B6 or OT-II T-cells, oxygen consumption rate (OCR), measured by Seahorse, is increased under acidic conditions (two-tailed, unpaired t-test, mean ± SD, n = 8 biological samples. PPR (B6, p = 1.35E-11; OT-II, p = 1.62E-11), OCR (B6, p = 2.22E-5; OT-II, p = 1.14E-5). Asterisks (***) represent p < 0.0001). c Glucose consumption and lactate production as a function of pHe in OT-I T-cells, expressed as mean ± SD; n = 3 biological samples. Significance tested by one-way ANOVA with multiple comparisons p < 0.001. d Schematic diagram of feedback loop between lactic acid production by glycolysis, and its inhibitory feedback by extracellular pH. e Time course of pHe measured in 60 µl volumes of 5 mM HEPES-buffered media containing no cells, nonactivated T-cells or activated (CD3-coated plates, then incubated in media containing 2 µg/ml CD28) T-cells at the densities indicated. n = 3 biological replicates. Data shown as mean ± S.E.M. Activated T-cells acidify the restricted extracellular volume towards pH 6.3 within several hours. f Schematic representation of mathematical model used to simulate the relationship between extracellular pH and lactate for a system featuring glycolytic lactic acid production and feedback inhibition by extracellular pH, as determined from panel e (i.e. linear inhibition towards zero production at pH 6.3), for a LN paracortex of intracellular volume fraction vi, and fluid turnover (perfusion) of τ. (g) Results of simulation for extracellular pH (upper panel) and lactate (lower panel). Black line shows the combination of vi and τ that simulates experimentally observed data for pHe (6.3; Fig. 1) and lactate (9.4 mM; Fig. S5). h Replotting of the best-fit curves from panel g. Red dashed line shows solution of this mathematical problem using the literature value for τ of 20 min. This indicates that ~70% of the paracortical zone is occupied by T-cells, engaged in lactic acid production, the source of low pHe measured in LNs.

