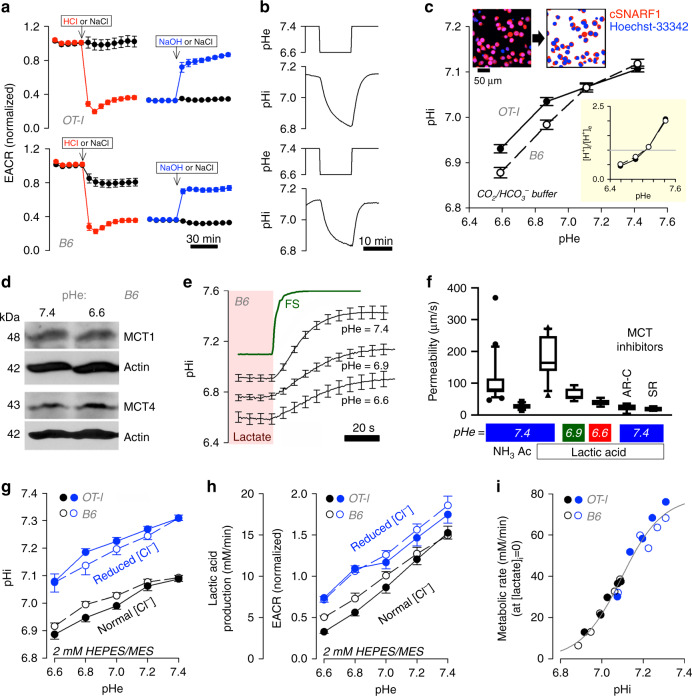
Fig. 3. Mechanism of T-cell glycolysis inhibition by low pH.
a An injection of HCl abruptly reduces extracellular acidification rate (ECAR) in OT1 and B6 T-cells; this reverses upon an injection of NaOH. NaCl injections performed as sham controls. Solutions were lightly buffered with 2 mM HEPES/MES mixture and titrated to desired pH. Mean ± SEM (n = 4 biological replicates). b A reduction in extracellular pH (pHe) evokes a delayed fall in intracellular pH (pHi), as measured from cSNARF1 fluorescence (2 mM HEPES/MES mixture). Mean of 10 time course recordings; error bars not shown for clarity. c Fluorescence imaging of cells under superfusion with CO2/HCO3− buffer. Cells co-loaded with cSNARF1 (red) to report pH and Hoechst-33342 (blue) to exclude nuclear areas from the analysis. Plot shows relationship between pHe and pHi at the steady-state in OT1 and B6 cells. Note the transmembrane [H+] gradient, shown in inset, inverts near resting pHi. Mean ± SEM of 5 recordings of fields of view containing 40–60 cells. d Western blot for MCT1 (48 kDa) and MCT4 (43 kDa) relative to actin (42 kDa) on lysates collected from B6 T-cells that had been incubated at pHe 7.4 or 6.6 (N = 3). (See Supplementary Fig. S17 for full blot). e Measuring total MCT activity from the rate of pHi change driven by transmembrane lactate efflux. T-cells under superfusion were equilibrated with one of the three conditions, 30 mM lactate at pHe 7.4, 15 mM lactate at pHe 6.9 or 7.5 mM lactate at pHe 6.6. Note that, for lower pHe, the lactate concentration was reduced to ensure that comparable levels of lactic acid are present at equilibrium. Rapid switching to lactate-free solution at the same pHe evoked net lactate efflux. Apparent permeability to lactic acid can be calculated from the rate of pHi change, buffering capacity and transmembrane gradient. To confirm that the ensuing pHi response was not rate-limited by the speed of solution exchange, one solution was labelled with fluorescein sulphonic acid (FS) and the rate of fluorescence-change indicated an exchange time constant of 2.6 s. Mean ± SEM of 10 cells per condition. f Apparent membrane permeability for NH3 (added as 15 mM NH4Cl; n = 21) acetic acid (Ac; 30 mM NaAcetate; n = 12) and lactic acid (7.5–30 mM Na Lactate) at high (n = 12), intermediate (n = 6), and low (n = 8) pHe. Indicated experiments performed in the presence of MCT inhibitors AR-C (AR-C155858; 10 µM; n = 7) and SR (SR13800; 10 µM;; n = 7). Mean ± S.E.M. of 7–15 cells per condition. Box shows median and 25–75% percentiles and whiskers show 10–90% percentile. g Steady-state relationship between pHe and pHi mapped for 2 mM HEPES/MES solution containing either normal (140 mM) or reduced [Cl] (7 mM), iso-osmotically substituted with gluconate to offset pHi at constant pHe. Mean±SEM of 6 recordings with 40–60 cells each. h EACR, calibrated to units of lactic acid-production rate (mM/min), is shown not to be a unique function of pHe; Data shown are Mean ± S.D., n = 14 wells over two independently seeded plates. i Data from g and h analyzed to generate a relationship between metabolic rate, extrapolated to lactate-free conditions (see Eq. (1)). Best-fit is a simple function of pHi, described by a Hill curve.

