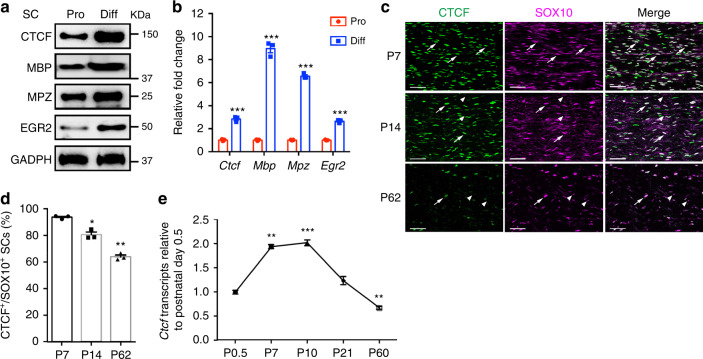
Fig. 1. CTCF expression changes during SC-lineage progression.
a Western blots for CTCF, MBP, MPZ, and EGR2 in proliferating and differentiated rat SC cultures. GAPDH served as a loading control. n = 2 independent experiments. b Relative qPCR expression of Ctcf, Mbp, Mpz, and Egr2 in proliferating and differentiated rat SC cultures. Data are presented as means ± SEM., ***P < 0.001, n = 3 independent experiments; two-tailed unpaired Student’s t-test, P(Ctcf) = 0.00021, P(Mbp) = 2.8E-05, P(Mpz) = 1.7E-06, P(Egr2) = 3.9E-05. c Colocalization of CTCF with SOX10 in SC nuclei from mice at P7, P14, and P62 evaluated by immunofluorescence labeling. Representative images are shown. n = 3 nerve tissues at each time point. Arrows indicate SOX10+/CTCF+ SCs; arrowheads indicate SOX10+/CTCF− SCs. Scale bars: 50 μm. d The percentage of CTCF+ nuclei in SCs (SOX10+) in sciatic nerves from P7, P14, and P62 mice. n = 3 control tissues at each time point. Data are presented as means ± SEM., *P < 0.05, **P < 0.01; n = 3 nerve tissues at each time point; one-way ANOVA with multiple comparisons test. P(P14) = 0.0392, P(P62) = 0.0052. e Relative qPCR expression of Ctcf in mouse sciatic nerves at various developmental stages. Data are presented as means ± SEM., **P < 0.01, ***P < 0.001; n = 3 nerve tissues at each time point; one-way ANOVA with multiple comparisons test, P(P7) = 0.0067, P(P10) = 0.0004, P(P21) = 0.1503, P(P60) = 0.0077. Source data are provided as a Source Data file.

