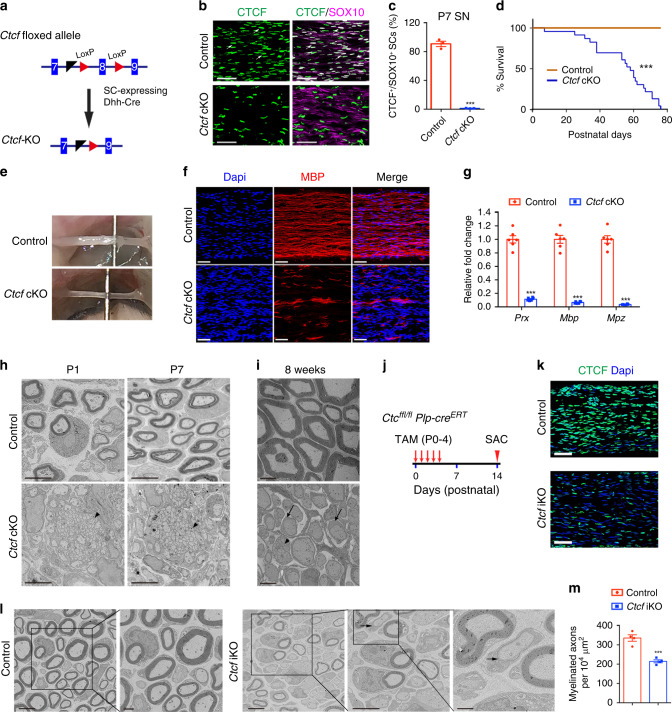
Fig. 3. CTCF is required for peripheral nerve ensheathment.
a Excised exon 8 of the floxed Ctcf allele by Dhh-Cre. b Co-labeling of CTCF with SOX10 in control and mutant sciatic nerves at P7 (n = 3 animals/genotype). Arrows indicate SOX10+/CTCF+ SCs. Scale bars: 50 μm. c The percentage of CTCF+ nuclei in SCs (SOX10+) from control and Ctcf cKO sciatic nerves at P7. n = 3 animals/genotype, P = 1.73E-05. d Survival curves of control and Ctcf cKO mice. n = 25 for control and n = 23 for Ctcf cKO mice, ***P < 0.001. e Representative photographs of sciatic nerves from P13 control and Ctcf cKO mice. n = 3 animals/genotype. f Immunofluorescence labeling of MBP (red) in P7 control and Ctcf cKO sciatic nerves. n = 3 animals/genotype. Scale bars: 50 μm. g The mRNA levels of myelin-related genes in P7 control and Ctcf cKO sciatic nerves. n = 6 animals/genotype. P(Prx) = 1.9E-08, P(Mbp) = 2.0E-08, P(Mpz) = 8.5E-09. h, i Ultrastructure of control and Ctcf cKO sciatic nerves at (h) P1 and P7 and at (i) 8 weeks. n = 3 animals/genotype. Arrows and arrowheads indicate immature SCs and unsorted axons, respectively. Scale bars: 4 μm. j A diagram showing the tamoxifen (TAM) administration scheme. k Immunofluorescent labeling of CTCF (green) nuclei in control and Ctcf iKO sciatic nerves at P14. Scale bars: 50 μm. n = 3 animals/genotype. l EM images of P14 sciatic nerves from control and Ctcf iKO mice. n = 4 animals/genotype. Arrow indicates myelin membrane. Scale bars: 4 μm, and 1 μm in the inset on the right panel. m Myelinated axon numbers 10−4 μm−2 sections of P14 sciatic nerves from control and Ctcf iKO mice. n = 4 animals/genotype, P = 0.0006. Data are presented as means ± SEM., ***P < 0.001; Statistical analyses performed using two-tailed unpaired Student’s t-test; Log-rank test used for survival curve. Source data are provided as a Source Data file.

