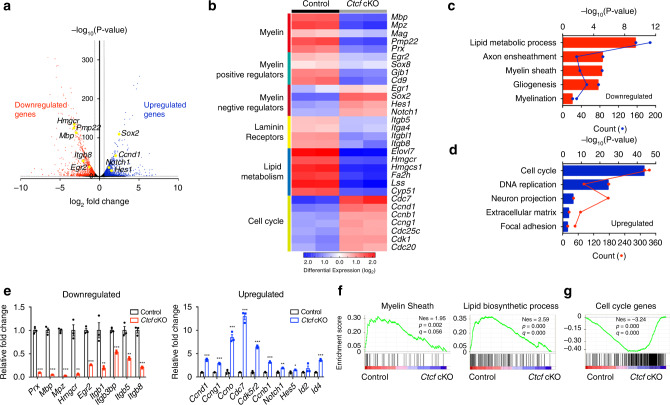
Fig. 6. CTCF regulates the transcriptional program of SC differentiation.
a Volcano plot of transcriptome profiles of control and Ctcf cKO sciatic nerves (n = 2 animals/genotype). Red and blue dots represent significantly downregulated and upregulated genes in Ctcf cKO nerves compared to the control, respectively (P < 0.05, fold-change > 1.5). b Heatmap of representative genes and their categories differentially expressed in control and Ctcf cKO sciatic nerves (n = 2 animals/genotype). c, d Bar plots of gene ontology analysis of genes c downregulated and d upregulated genes in Ctcf cKO sciatic nerves compared with control nerves. Each dot (connected by lines) represents the gene count of the corresponding biological function categories. n = 2 independent tissues/genotype. e qPCR analysis of genes related to SC development that are decreased (left) and increased (right) in Ctcf cKO sciatic nerves relative to control. f GSEA enrichment scores for myelin sheath (left) and lipid biosynthetic process (right) gene sets in control and Ctcf cKO sciatic nerves. g GSEA enrichment scores for cell-cycle gene sets in control and Ctcf cKO sciatic nerves. Data are presented as means ± SEM., ***P < 0.001, **P < 0.01, *P < 0.05, n = 3 animals/genotype; two-tailed unpaired Student’s t-test, P(Prx) = 2.6e-05, P(Mbp) = 4.9E-05, P(Mpz) = 5.3E-06, P(Hmgcr) = 0.0014, P(Egr2) = 8.6E-05, P(Itgb1) = 0.008, P(Itgb3bp) = 0.00022, P(Itgb5) = 0.0021, P(Itgb8) = 0.00017, P(Ccnd1) = 7.4E-05, P(Ccng1) = 5.1E-05, P(Ccno) = 0.0004, P(Cdc7) = 6.4E-05, P(Cdk5r2) = 1.6E-05, P(Ccnb1) = 3.2E-05, P(Notch1) = 0.00102, P(Hes5) = 0.028, P(Id2) = 0.23, P(Id4) = 3.3E-05. Source data are provided as a Source Data file.

