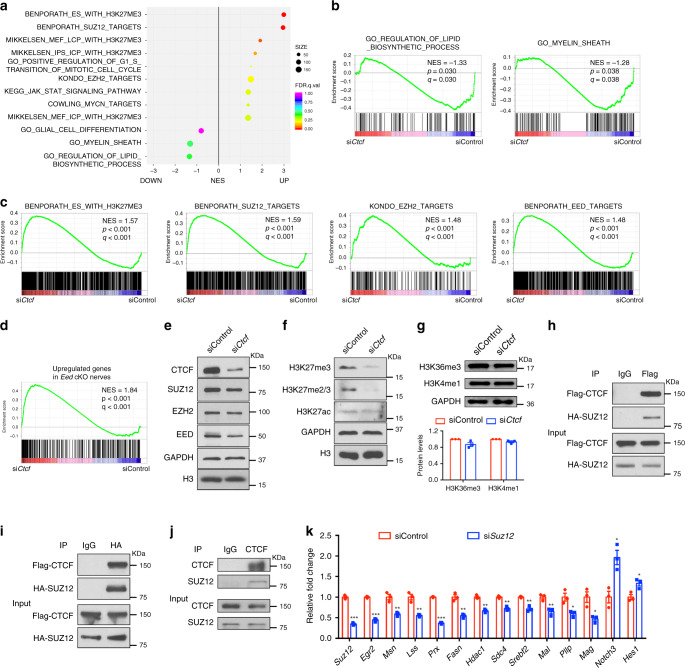
Fig. 8. CTCF cooperates with PRC2 complex to regulate SC differentiation.
a GSEA enrichment scores for sets of genes differentially regulated in rat SCs treated with siCtcf or control siRNA. n = 3 independent experiments. b GSEA enrichment scores for genes involved in lipid biosynthetic process (left) and myelin sheath (right) in SCs treated with control or siCtcf. c GSEA enrichment scores for genes modified with H3K27me3 and for genes targeted by SUZ12, EZH2, or EED in SCs treated with control or siCtcf. d GSEA enrichment scores for genes upregulated genes in Eed cKO nerves from published data37. NES, normalized enrichment score. e–g Immunoblotting for e PRC2 complex and CTCF proteins and for f, g histones with indicated modifications in SCs treated with control or siCtcf. e, f n = 2 independent experiments; g n = 3 independent experiments. h–j Co-immunoprecipitation of h, i HA-SUZ12 with Flag-CTCF from extracts of transiently transfected HEK293T cells or of j endogenous SUZ12 with CTCF from rat SCs. n = 2 independent experiments. k qRT-PCR analysis showing Suz12 and differentiation-related and myelin-related gene expression in rat SCs transfected with control siRNA or with Suz12-targeted siRNA (n = 3 independent experiments) and induced to differentiate for 9 h. Data are presented as means ± SEM., ***P < 0.001, **P < 0.01, *P < 0.05; two-tailed unpaired Student’s t-test, P(Suz12) = 3.8E-05, P(Egr2) = 3.3E-05, P(Msn) = 0.0045, P(Lss) = 0.0031, P (Prx) = 1.5E-06, P(Fasn) = 0.0019, P(Hdac1) = 0.0019, P(Sdc4) = 0.0015, P(Srebf2) = 0.0026, P(Mal) = 0.008, P(Pllp) = 0.018, P(Mag) = 0.017, P(Notch3) = 0.012, P(Hes1) = 0.02. Source data are provided as a Source Data file.

