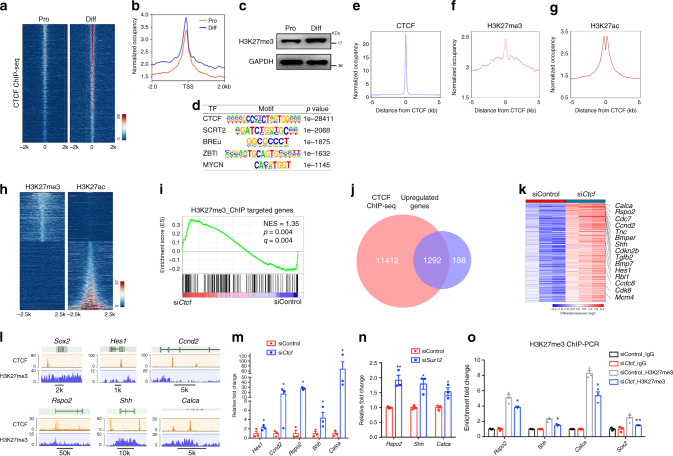
Fig. 9. CTCF and SUZ12 regulate transcriptomic dynamics during SC differentiation.
a Heatmap of CTCF ChIP-seq peaks from proliferating and differentiated SCs. n = 1 in each condition. b ChIP-seq enrichment around TSS regions in proliferative and differentiated SCs. c Immunoblotting for H3K27me3 in proliferating and differentiating SCs. n = 2 independent experiments. d Enriched motifs of transcription factors (TF) in the CTCF-bound regions. e–g ChIP-seq enrichment around CTCF binding regions for e CTCF, and g H3K27ac in rat SCs, f H3K27me3 in rat sciatic nerves. h Heatmap for H3K27me3 and H3K27ac. The sites are ranked in ascending order of H3K27ac intensity. n = 1 in each condition. i GSEA enrichment for genes with H3K27me3 peaks associated with TSSs in siControl or siCtcf rat SCs. NES, normalized enrichment score. j Overlap between CTCF-bound and upregulated genes differentially expressed in rat SCs treated with control siRNA or siCtcf. k Heatmap of CTCF-targeted upregulated genes in rat SCs treated with control siRNA or siCtcf. n = 3 in each condition. l Tracks for the indicated genes with ChIP-seq of CTCF from rat SCs and of H3K27me3 from rat sciatic nerves. n = 1 in each condition with 20 million cells. m Expression of the indicated genes in RNA-seq dataset from rat SCs treated with control siRNA or siCtcf. n = 3 independent experiments, P(Hes1) = 0.011, P(Ccnd2) = 0.01007, P(Rspo2) = 0.0105, P(Shh) = 0.019, P(Calca) = 0.041. n qRT-PCR for the indicated genes in rat SCs treated with control siRNA or siSuz12. n = 3 independent experiments, P(Rspo2) = 0.006, P(Shh) = 0.012, P(Calca) = 0.02. o ChIP-qPCR for H3K27me3 at the promoters of the indicated genes in rat SCs treated with control siRNA or siCtcf. IgG were normalized to 1; n = 3 independent experiments, P(Rspo2) = 0.039, P(Shh) = 0.011, P(Calca) = 0.039, P(Sox2) = 0.0094. Data are presented as means ± SEM, *P < 0.05, **P < 0.01, ***P < 0.001, two-tailed unpaired Student’s t-test. Source data are provided as a Source Data file.

