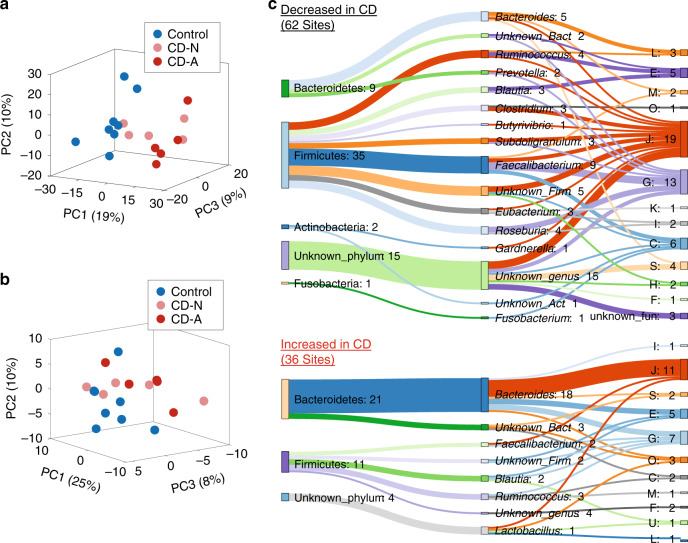
Fig. 4. Lysine acetylome alterations of the intestinal microbiome in pediatric CD.
a PCA score plot of the metaproteome of the intestinal microbiome. b PCA score plot of the lysine acetylome of the intestinal microbiome. c Differentially abundant microbial Kac sites. The COG category and taxonomy (phylum and genus) for the differentially abundant Kac sites are shown in the Sankey plot. The numbers after the colons indicate the numbers of differentially abundant Kac sites. The phylum-genus links and genus-function (COG category) links are shown. Each letter corresponds to a COG category as shown in Fig. 3. The Sankey plot was generated using SankeyMATIC (http://sankeymatic.com/). Source data are provided as a Source Data file.

