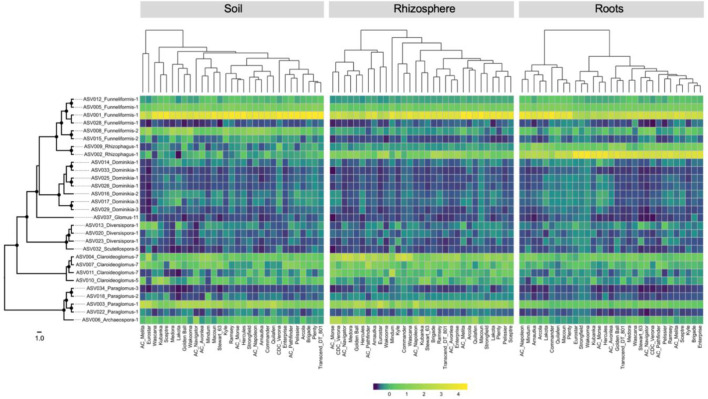
Figure 4.
Heatmaps showing the relative abundance of each of the 29-core amplicon sequence variants recorded in soil, rhizosphere, and root compartments for the five landraces and 26 durum wheat cultivars. Left: RAxML phylogeny of 29 core ASVs, black circles on the nodes represent bootstrap values > 70. The scale represents the branch length corresponding to expected substitutions per site. Top: cladogram showing the relationships between each cultivar based on the distance matrix calculated on ASV relative abundance.

