Figure 5.
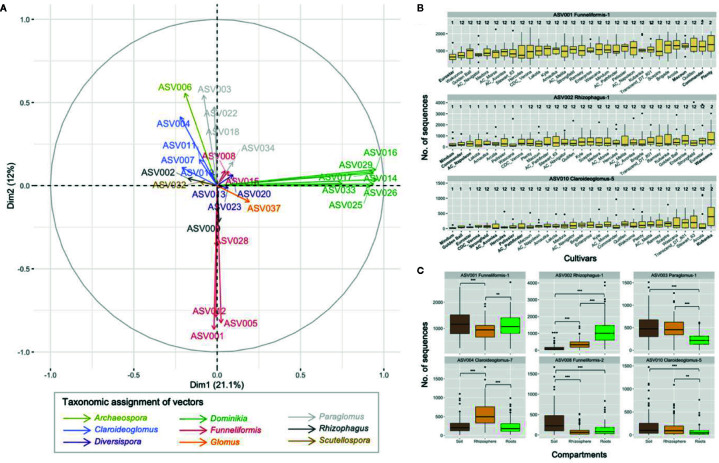
(A) Principal component analyses on 29 ASVs with non-zero values in > 50% of the samples across the three compartments (category ASV50+). The first two principal components explained 33.1% of variance. (B) Boxplots showing the abundance of the three ASVs for which significant differences were recorded between the pairwise comparisons of the 31 cultivars of durum wheat. Boxplots with a different number indicate significant differences between cultivars (p < 0.05). Boxplots were ordered by increasing mean abundance. (C) Boxplots showing the abundance of the six ASVs for which the significant differences were found between soil, rhizosphere and root compartments. Non-significant differences are not shown, ** and *** indicate p values < 0.01 and < 0.001, respectively.

