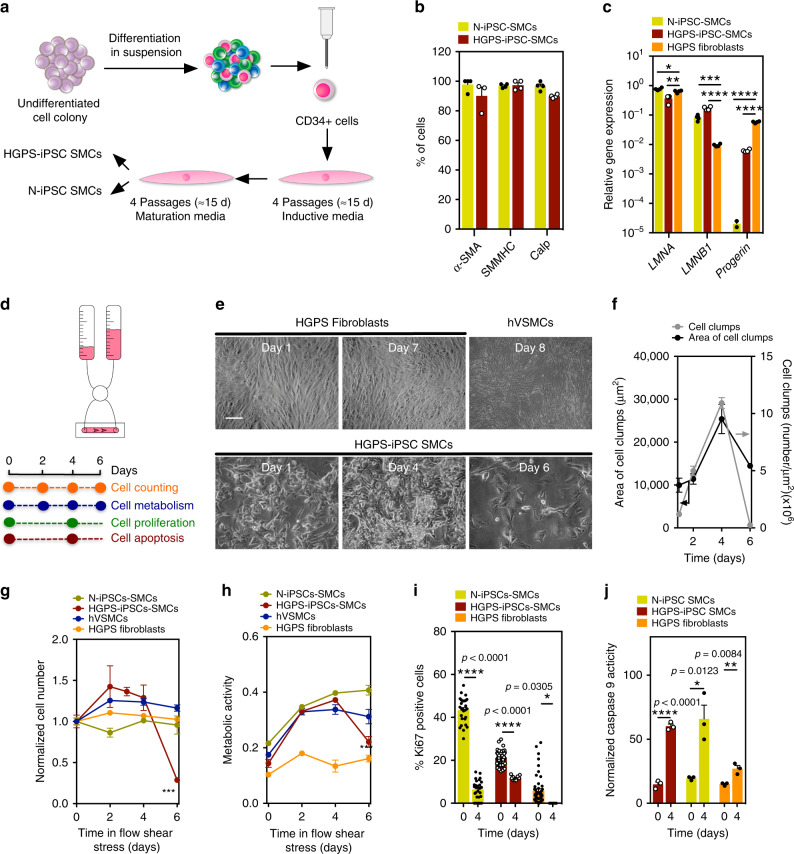
Fig. 1. Vulnerability of HGPS-iPSC SMCs to arterial flow conditions.
a Schematic representation of the methodology used to differentiate iPSCs into SMCs. b Expression of SMC markers on iPSC-derived SMCs. Percentage of positive cells expressing SMC markers as evaluated by immunofluorescence (at least 100 cells were counted per each marker). Results are mean ± SEM (n = 3 independent experiments). c Expression of progeria markers on iPSC-derived SMCs. Gene expression by qRT-PCR (gene expression was normalized by the housekeeping gene GAPDH). HGPS fibroblasts were used as control. Results are mean ± SEM (n = 4 technical replicates from a pool of three independent experiments). *, **, ***, **** denote statistical significance (p < 0.05, p < 0.01, p < 0.001, p < 0.0001). Statistical analyses were performed by one-way ANOVA followed by Newman–Keuls’s post test. d Schematic representation of the protocol used. Cells were cultured for 6–8 days in arterial flow conditions (20 dyne/cm2). e Light microscopy images of HGPS fibroblasts, hVSMCs, or HGPS-iPSC SMCs (10% of the cells accumulate progerin protein) at different culture days. Only HGPS-iPSC SMCs detached from the microfluidic system at day 4. Scale bar is 50 μm. f Number and area of cell clumps in HGPS-iPSC SMCs at different times (at least two images (×10) have been quantified per time). For area of cell clumps n > 2 images examined over three independent experiments; for cell clumps, n = 3 independent experiments. g Number of cells per surface area (mm2) during cell culture under arterial flow (at least three images (×10) have been quantified per time; n = 3–7 independent experiments). Cell number was normalized by the number of cells present at day 0. h Cell metabolism evaluated by the Presto Blue assay. Absorbance at 570 nm was measured and normalized to the 600-nm values for the experimental wells. n = 3 independent experiments. i Expression of nuclear proliferation marker, Ki67 (at least three images (×10) have been quantified per time). The percentage of Ki67 positive cells was evaluated by immunofluorescence. n > 3 images examined over three independent experiments. j Cell apoptosis evaluated by caspase-9 activity. Results were normalized by cell number. n = 3 independent experiments. From c to g, results are mean ± SEM. *, **, ***, **** denote statistical significance (p < 0.05, p < 0.01, p < 0.001, p < 0.0001). Statistical analyses were performed by a two-tailed unpaired Student’s t test i and j.

