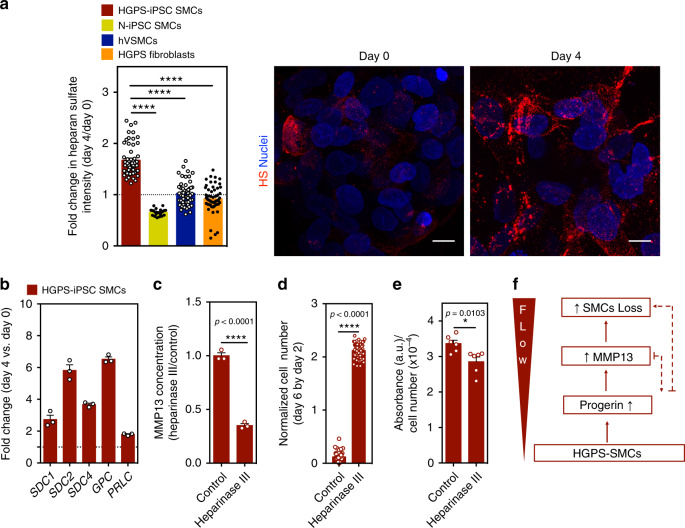
Fig. 8. MMP13 expression in SMCs is triggered by an increase in heparan sulfate.
a Cells were cultured under flow conditions for 4 days and the expression of heparan sulfate was evaluated by immunofluorescence. Intensity of heparan sulfate was calculated in each picture and normalized by cell number. The normalized fluorescence intensity at day 4 was divided with the one at day 0. Scale bar is 10 μm. n > 4 images examined over six independent experiments. Statistical analyses were performed by one-way ANOVA followed by Newman–Keuls’s post test. b Gene expression of glycocalyx markers (SDC1: syndecan 1, SDC2: syndecan 2, SDC4: syndecan 4, GPC: glypican, PLC: perlecan), as evaluated by qRT-PCR, in HGPS-iPSC SMCs cultured under flow conditions. Gene expression was normalized by the housekeeping gene GAPDH, and the normalized gene expression at day 4 divided by day 0. n = 3 technical replicates from a pool of three independent experiments. c HGPS-iPSCs-SMC cultured under flow condition were treated or not with heparinase III and the number of cells per microfluidic area during culture was calculated and normalized by the number of cells present at day 2. n = 3 independent experiments. Statistical analyses were performed by a two-tailed unpaired Student’s t test. d Quantification of MMP13 activity (cell culture media) by ELISA. Cells were analyzed at day 4 under flow. Fluorescence signal was normalized by cell number and then by control experimental group. n > 9 images examined over six independent experiments. Statistical analyses were performed by a two-tailed unpaired Student’s t test. e Expression of alkaline phosphatase in HGPS-iPSCs SMC, normalized by cell number per mm2, in cells cultured 4 days under flow conditions. Cells were treated or not with heparinase III. n = 2 technical replicates over three independent experiments. Statistical analyses were performed by a two-tailed unpaired Student’s t test. In a–e, results are mean ± SEM. *, **, ***, **** denote statistical significance (p < 0.05, p < 0.01, p < 0.001, p < 0.0001). f Summary of the results.

