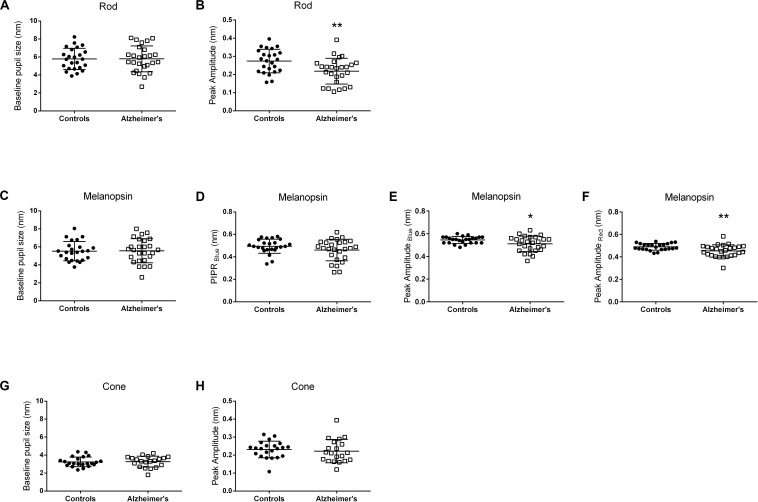
FIGURE 2.
Pupillometric parameters for controls and AD. Panels show scatterplots with horizontal solid line represents the mean and error bars representing standard deviations for each group. (A,B) Show the results for the Rod-condition; (C–F) Show the results for the Melanopsin-condition [(C–E) 450 cd/m2, 472 nm-blue; (F) 450 cd/m2, 632 nm-red]; (G,H) Show the results for the Cone-condition. (A,C,G) Show normalized pupil size at baseline. (B,E,F,H) Show normalized transient peak amplitude. (D) Show normalized melanopsin-mediated Post-Illumination Pupil Response (PIPRBlue). Peak amplitude (transient peak amplitude) was defined as the difference between the normalized baseline pupil size and the median normalized PLR at the point of maximum pupillary constriction after stimulus onset. PIPR was defined as the difference between the normalized baseline pupil size and the median normalized PLR measured over a 5 to 7 s time interval from stimulus offset. Significant different between controls and AD patients are indicated by an asterix symbol above the groups. *p < 0.05; **p < 0.01.

