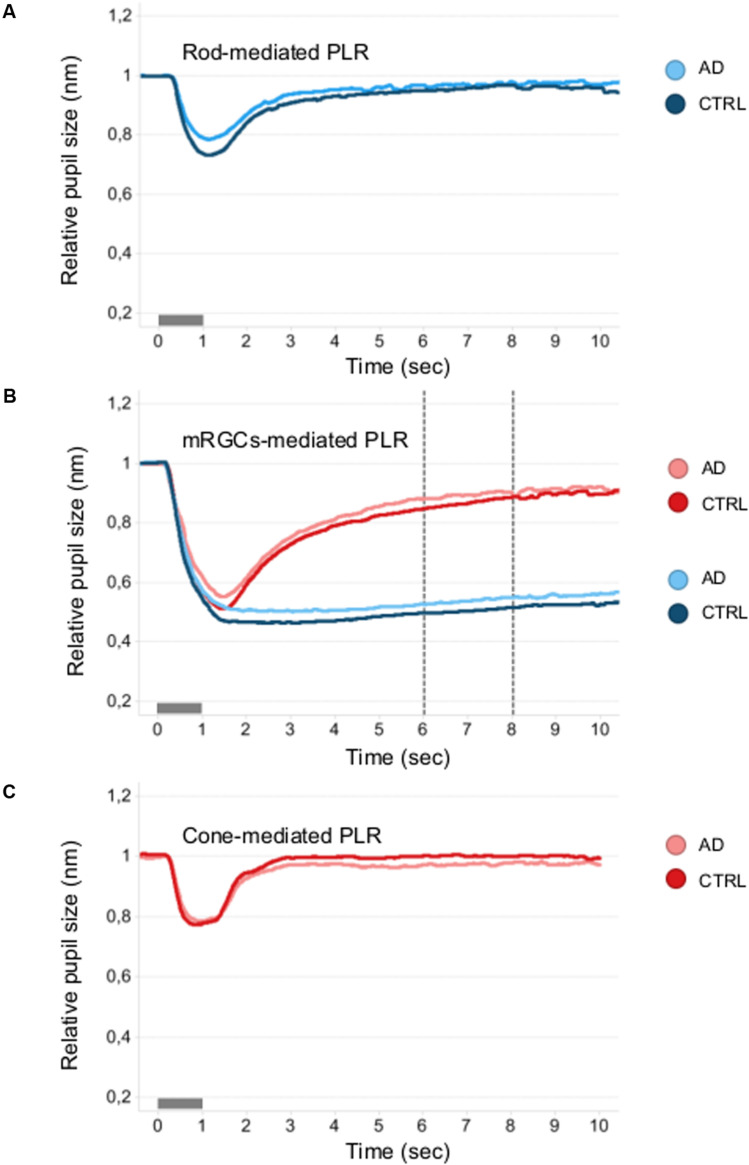
FIGURE 3.
Mean pupillometric waveforms obtained under the rod, melanopsin, and cone conditions in controls and AD. (A) Shows PLR measured under the rod-condition with the short- (blue) wavelength flashes (0.001 cd/m2) presented in the dark, for comparison between control (blue mean trace) and AD (azure mean traces) groups. (B) Shows PLR measured under the melanopsin-condition, including the two photopically-matched intense long- (red) and short- (blue) wavelength flashes (450 cd/m2) presented in the dark, for comparison between control (red and blue mean traces) and AD (pink and azure mean traces) groups. The vertical dotted lines indicate the time interval (5–7 s from stimulus offset) over which the melanopsin-mediated (sustained) amplitude (PIPR) was measured. (C) Shows PLR measured with the long- (red) wavelength flashes (10 cd/m2) presented against the rod-suppressing blue adapting field (6 cd/m2) for comparison between control (red mean trace) and AD (pink mean trace) groups.

