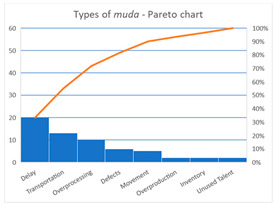
Table 4.
Summary of the different types of Muda: (a) Data, (b) Pareto chart.
| Type of Muda | Count | % | Cumul % |

|
| Delay | 20 | 33% | 33% | |
| Transportation | 13 | 22% | 55% | |
| Overprocessing | 10 | 17% | 72% | |
| Defects | 6 | 10% | 82% | |
| Movement | 5 | 8% | 90% | |
| Overproduction | 2 | 3% | 93% | |
| Inventory | 2 | 3% | 97% | |
| Unused Talent | 2 | 3% | 100% | |
| Total | 60 | 100% | 100% | |
| (a) | (b) | |||
