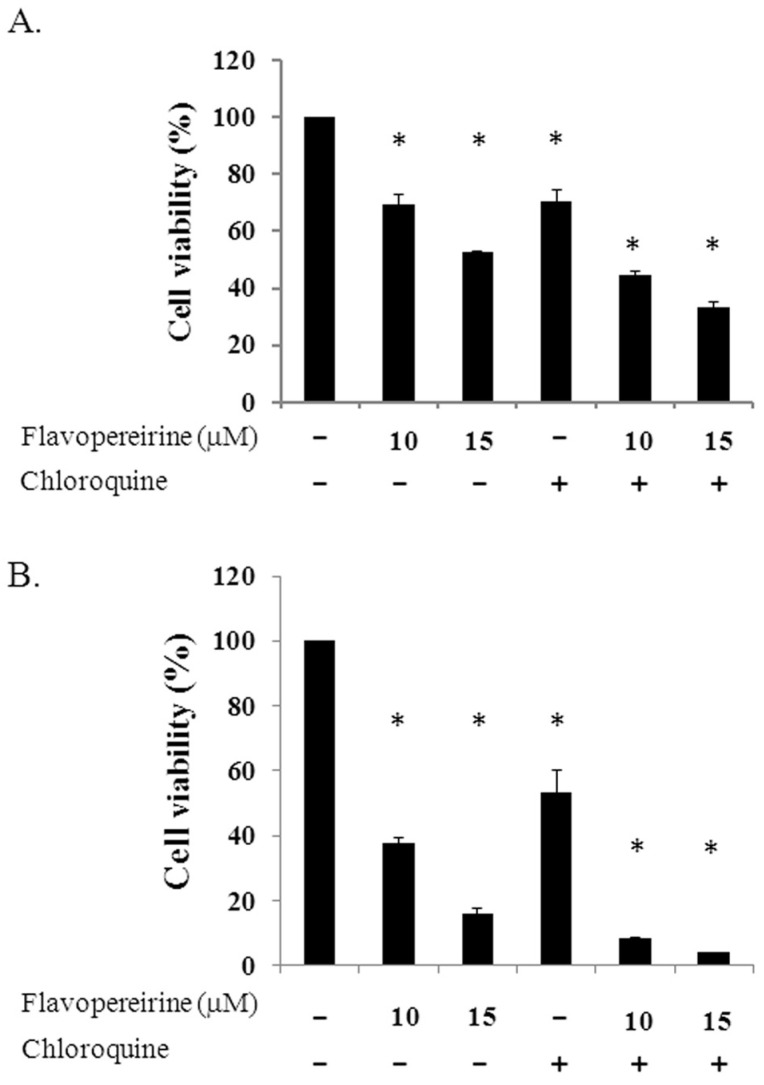
Figure 4.
Cell viability of MDA-MB-231 cells treated with individual or a combination of flavopereirine with chloroquine. Cells (4 × 10⁵/well) were treated with different concentrations of flavopereirine, chloroquine (25 μM), or a combination of the two drugs, and cell viability was evaluated by a cell counting kit-8 (CCK-8) after treatment for 24 h (A) and 48 h (B). Histograms show the mean ± SD of three independent experiments performed in triplicate. * Indicates a significant difference from its respective untreated control as analyzed by one-way ANOVA followed by a Bonferroni test (p < 0.05).

