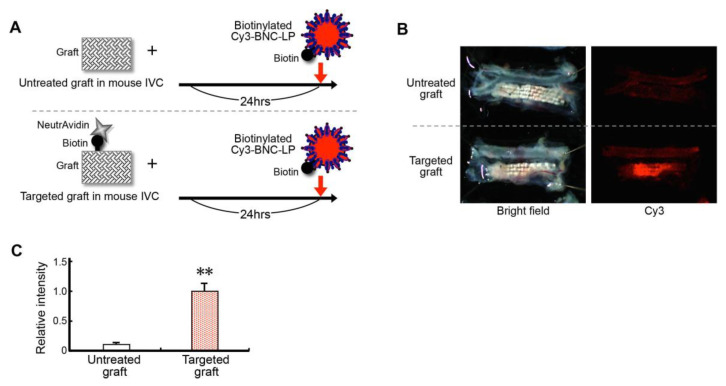
Figure 6.
Efficient charging of the targeted graft with the target-recognizing BNC-LP complex in vivo. (A) Schematic diagram of the experiment: the targeted graft is compared to the untreated control graft. (B, left) Bright field images show the grafts excised from mice after the experiment. (Right) Fluorescence images show the accumulation of Cy3-labeled BNC-LP on the targeted graft. (C) Efficiency of charging the targeted graft with the BNC-LP complex, determined by measuring the relative fluorescence intensity. Data are the means ± standard deviations of 3 independent observations. ** p < 0.01 compared to the untreated graft.

