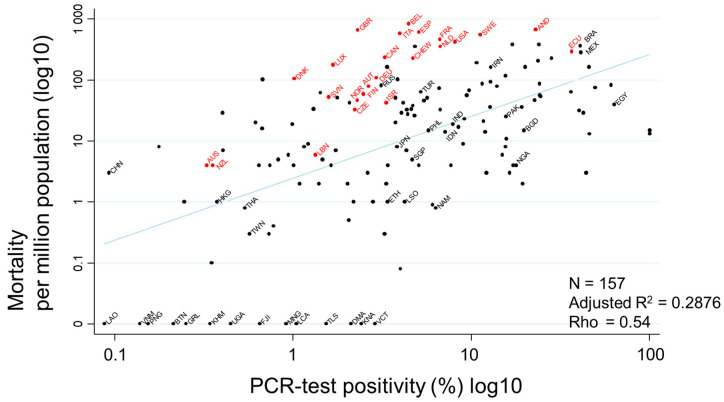
Figure 3.
Scatter plot showing the association between PCR-test positivity and mortality. Mortality per million population and PCR-test positivity rates (%) on 17 July 2020 were transformed to the common logarithm (log10) in the graph. Since the variable of ‘PCR-test positivity (log10)’ showed a normal distribution, Pearson’s correlation coefficient was applied to calculate rho, to quantify the strength of the association. Countries that never had or stopped a national BCG vaccine program are indicated in red, while countries with current national BCG vaccine programs are indicated in black. Selected country names are shown using three-letter country codes.

