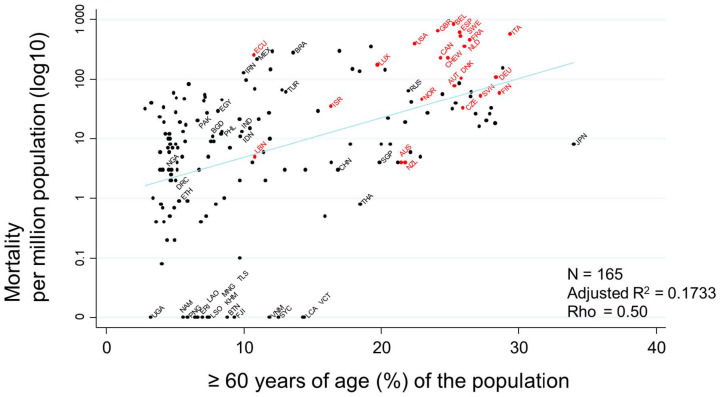
Figure 6.
Scatter plot showing the association between ≥60 years of age (%) of the population and mortality rate. Mortalities per million population on 17 July 2020 transformed to the common logarithm (log10) are presented in the graph. Since the variable of ‘percentage of population ≥ 60 years of age (%)’ showed a non-normal distribution, Spearman’s rank correlation was applied to calculate rho, to quantify the strength of the association. Countries that had never had or that had stopped their national BCG vaccine program are indicated in red, while countries that currently follow a national BCG vaccine program are indicated in black. Selected country names are shown using three-letter country codes.

